When using covered call writing and put-selling strategies it is important to set goals for initial returns in order to select the most appropriate underlying security and option. My goal for initial returns is 2% – 4% per month and a bit higher in a bull market environment. Recently, several of our members have contacted me inquiring about a way to scan eligible stocks for premiums that may meet these goals. This article will address this issue using our Premium Stock Report but other resources may be used as well.One of the columns inherent in our member reports is beta. This is a measure of the volatility of a security as compared to the S&P 500. A stock with a beta of “1″ has the same statistical or historical volatility as the S&P 500 and would be expected to perform similarly. Stocks with betas > 1 have higher-than-market volatility and those with betas < 1 have lower-than-market volatility Beta is therefore based on actual historical statistics.
Implied volatility, on the other hand, is a market forecast of the underlying’s volatility as implied by the current option’s pricing. Implied volatility impacts option premium more directly than does beta. However, it makes sense that those securities with higher betas will generally also have higher implied volatilities, admittedly with some exceptions. With that in mind, we will set up a screen for higher option returns by screening for eligible stocks (passed our fundamental, technical and common sense screens) that have betas > 1.50. We also want to be sure that the stocks have no earnings reports due out before contract expiration and the associated options have adequate open interest.
Below is a screenshot of the information gleaned from the Premium Stock report dated 2-13-15 (members wait for the new report to come out) and the option chains:

High-beta stocks
You will note that five of the nine candidates are in the “Chips” industry segment so we must be cautious not to over weigh our portfolio in one particular segment. If more candidates are needed, we can always drop our beta requirement a bit, perhaps to > 1.30. Next, we will enter the options data into the multiple tab of the Ellman Calculator (free copy by clicking the “Free Resources” link on the top black bar of this page and then scrolling down to sign in). For the purposes of this article, we will view out-of-the-money strikes only but this can be expanded to other strikes as well:
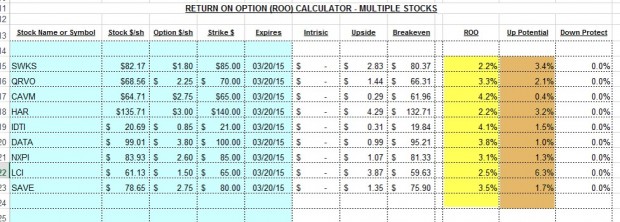
Calculations for stocks with high betas
The column highlighted in yellow, ROO, represents the actual time value initial returns which do meet our 2%c – 4% goals. The column featured in brown, upside potential, shows additional profit that may be generated if share price moves up from current market value to the strike. For example, should SWKS move up from its current price of $82.17 to the $85 strike, the total 1-month return would be 5.6% (2.2% initial profit + 3.4% from share appreciation to the strike).
Summary
One approach to screening eligible stocks for higher option returns is to look at beta statistics. The process includes setting initial goals, establishing a minimum beta required, checking options chains and then running the calculations. All this should take less than 20 minutes for those with a quality watch list.
FREE Beginners Corner tutorial for puts
Just added to our website: An 8-part video series based on my latest book. Each of the 8 videos are between 5 -10 minutes long. Click on the link shown below and enter your email address to enter the classroom:

Link to Beginners Corner for puts
Next live seminars:
February 28th and March 1st
The International Stock Trader’s Expo: New York City: Marriott Marquis Hotel
Saturday February 28th 12:50 to 1:35 PM (new time)
Sunday March 1st 1:30 – 2:30 PM
Both seminars are free to attend.
-
The minutes from the January 27 -28 FOMC meeting reflects continued discussion as to when to raise interest rates, a positive sign for the resilience of our economy
-
The Conference Board’s leading Economic Index (LEI) rose by 0.2% in January below the 0.3% expected, but still suggesting a bullish short-term outlook in 2015
-
The Producer price Index (PPI) dropped by 0.8% in January (economists projected a drop of 0.4%) mainly due to declining energy prices
-
Housing starts fell to 1,065,000 in December, a drop of 2% but year-over-year growth was up 18.7%. Severe weather conditions were a major factor
-
Building permits were down by 0.7% in December but up 8.1% year-over-year
-
Industrial production rose by 0.2% in January lower than the 0.3% projected by experts
-
Initial jobless claims for the week ending February 14th came in at 283,000, less than the 292,000 expected
Summary
IBD: Confirmed uptrend
GMI: 6/6- Buy signal since market close of January 23, 2015
BCI: Cautiously bullish using an equal number of in-the-money and out-of-the-money strikes. Global issues are still looming over our markets as possible short-term negative factors
Wishing you the best in investing,
Alan (alan@thebluecollarinvestor.com)