One of our covered call writing exit strategies when the strike is in-the-money on expiration Friday is rolling out-and-up. This is when we buy back the near-month call (buy-to-close) and sell the next month’s higher strike. There are times when share appreciation has dramatically increased above the near-month strike price such that buying back the current call option can be expensive relative to the premium originally generated. The question we ask ourselves is whether the cost-to-close is justified? On June 15, 2018 (expiration Friday), Karl wrote me about such a scenario he was considering with Five Below, Inc (NASDAQ: FIVE).
Karl’s initial trade with Five Below, Inc. (NASDAQ: FIVE)
- 5/17/2018: Buy 100 FIVE at $76.19
- 5/17/2018: Sell 1 x June $75.00 call at $2.86
Initial trade calculations using the multiple tab of the Ellman Calculator
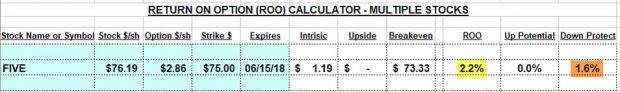
Initial Calculations with FIVE for the June Contract
- Yellow field: Time value return on option is 2.2%
- Brown field: Downside protection of the initial time value profit is 1.6%
Expiration Friday statistics
- FIVE trading at $102.09
- Cost-to-close the June $75.00 contract is $27.50 ($27.09 of intrinsic value and $0.41 of time value)
- Premium generated when selling the July $105.00 contract (rolling out-and-up) is $2.80
Rolling out-and-up calculations using the “What Now” tab of the Ellman Calculator
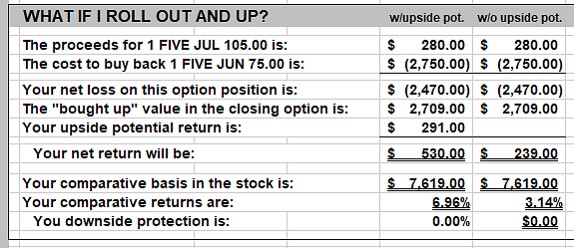
Rolling Out-And-Up with FIVE
- The intrinsic value component of the $27.50 cost-to-close ($27.09) is neutralized by the increase in share value from the $75.00 contract sale obligation to the current share value of $102.09
- The initial return on option (ROO) from rolling out-and-up is 3.14% (without upside potential)
- The potential total return (if share value moves to the new $105.00 strike) is 6.96%
Approaching the trade when there is a bullish assessment
In my books and DVDs, I define rolling out-and-up as a bullish exit strategy where we still like the underlying security and overall market environment. That said, how would this trade look if we were never in a trade with FIVE for the June contract and were considering this stock for the July contract:
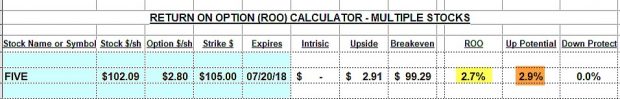
FIVE Calculations for the July Contract
- Initial 1-month ROO is 2.7% (yellow field)
- Upside potential is 2.9% (brown field)
- Total 1-month potential return is 5.6%
Discussion
Rolling out-and-up is a bullish covered call writing exit strategy. We employ this position management technique when the stock continues to meet our system criteria and our overall market assessment is neutral to bullish. When evaluating the cost-to-close, we must factor in the increase in share value created by the intrinsic value component of the buy-to-close option premium.
**********************************************************************************************************************************************
HOLIDAY DISCOUNT CODE
Give the gift of education this holiday season and use this discount promo code to get a 10% discount at checkout on all items in the BCI store:
HOLIDAY10
Click here to enter the store the BCI store
**********************************************************************************************************************************************
Upcoming event
February 7th – 10th, 2019
Orlando Money Show
Omni Orlando Resort @ Champions Gate
February 7th – 10th 2019
Speaking schedule:
1. Getting Started with Stock Options: Creating Monthly Cash Flow with Covered Call Writing
February 8, 2019, 3:10 pm – 3:40 pm
2. Getting Started with Stock Options: How to Select the Best Options in Bull and Bear markets
February 9, 2019, 2:00 pm – 2:45 pm
Market tone
This week’s economic news of importance:
- Markit manufacturing PMI Nov. 55.3 (55.4 last)
- ISM manufacturing index Nov. 59.3% (58.0% expected)
- Construction spending Oct. -0.1% (0.3% expected)
- ADP employment Nov. 179,000 (225,000 last)
- Weekly jobless claims 12/1 231,000 (224,000 expected)
- Trade deficit Oct. (-)55.5 billion [(-) 55.1 billion expected)]
- Productivity Q3 2.3% (2.2% expected)
- Markit services PMI Nov. 54.7 (55.4 last)
- ISM non-manufacturing index Nov. 60.7% (59.1% expected)
- Factory orders Oct. (-)2.1% [(-) 2.0% expected]
- Nonfarm payrolls Nov. 155,000 (190,000 expected)
- Unemployment rate Nov. 3.7% (as expected)
- Average hourly earnings Nov. 0.2% (0.3% expected)
- Consumer sentiment index Nov. 97.5 (97.3 expected)
THE WEEK AHEAD
Mon Dec. 10th
- Job openings Oct.
Tue Dec. 11th
- Producer price index Nov.
Wed Dec. 12th
- Consumer price index Nov.
- Core CPI Nov.
- Federal budget Nov.
Thu December 13th
- Weekly jobless claims 12/8
- Import price index Nov.
Fri December 14h
- Retail sales Nov.
- Industrial production Nov.
- Business inventories Oct.
For the week, the S&P 500 moved down 4.60%% for a year-to-date return of -1.52%
Summary
IBD: Market uptrend under pressure
GMI: 2/6- Bearish signal since market close of November 13th, 2018 as of Friday morning
BCI: Selling an equal number of out-of-the-money and in-the-money strikes. Will hold with this ratio until the Fed announcement.
WHAT THE BROAD MARKET INDICATORS (S&P 500 AND VIX) ARE TELLING US
The 6-month charts point to a bearish tone. In the past six months, the S&P 500 down 5% while the VIX (23.34) moved up by 93%.
Wishing you much success,
Alan and the BCI team