Whether we are using covered call writing, put-selling or any other investment strategy, investor interpretation of results is an interesting topic to analyze. Is the glass half-full or half-empty? On October 5th, 2018, Gene wrote me about two covered call positions he was holding and expressed deep concern over the status of those trades. This article will review one of the trades, discuss potential exit strategy opportunities and examine the lessons learned.
Gene’s trades with Amarin Corp. (NASQAQ: AMRN)
- 9/17/2018: Buy 11,000 x AMRN at $1.88
- 9/17/2018: Sell 60 x $5 1/19/2019 calls at $1.17
- 9/17/2018: Sell 50 x $7 1/19/2019 calls at $0.60
- 10/5/2018: AMRN trading at $20.29 (not a misprint!)
Gene’s dilemma
Since the strike is deep in-the-money, exercise is likely and is currently, according to Gene, ” losing a lot of money” The question posed to me:
- How can exercise be avoided?
- What can be done to recover these losses
The price chart and news

AMRN Price Chart on October 5, 2018
Checking the news, we conclude that the price jump was related to positive news regarding this biotech company’s fish oil product as well takeover rumors:
https://finance.yahoo.com/news/apos-why-amarin-corporation-jumped-202400588.html
Initial calculations using the Ellman Calculator

AMRN Initial Calculations
Both strikes offer huge initial returns which, if realized, would result in annualized returns of over 5000%. As of October 5th, shares would have to move below the strike prices for these amazing returns not to be realized. If closed, the returns would still end up more than 250% for the 18-day period from 9/17 to 10/5.
Why is the glass half empty?
Although the trades are currently at maximum, impressive returns, more money could have been made had the calls not been written. This means that maximum covered call success was achieved (to date) but had another strategy been employed (straight stock ownership), better results could have been achieved.
AMRN option chain on October 5th
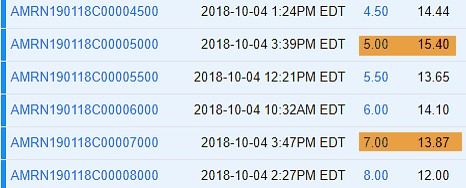
AMRN Option Chain for January 2019 Contracts
Action choices
1. Take no action and re-evaluate as expiration approaches…still 3 months+ to go.
2. Unwind entire position and use cash to establish additional income streams. For this, we would need to calculate the time value cost-to-close. Using the “Unwind Now” tab of the Elite version of the Ellman Calculator, we see the cost-to-close the $5 strike is 2.2% and the $7 strike is 8.29%. We ask ourselves, can we generate more than 2.2% or 8.29% over the next 3 months in a new position with a different stock? 2.2% absolutely; 8.29% maybe not. Covered call writers would be more likely to close the $5 strike and leave the $7 strike as things stand now if unwinding is considered (Known as the mid-contract unwind exit strategy in the BCI methodology).
Cost-to-close the $5 strike
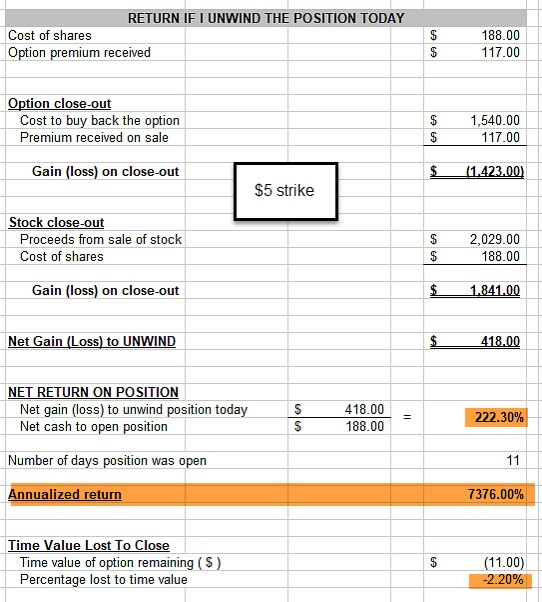
The Elite Ellman Calculator: Unwind Now Tab
Cost-to-close the $7 strike

Closing the $7 Strike
Lesson learned
The initial and current calculations reflect huge short-term returns. This is the good news. The negative concerns are inherent in using such a volatile underlying which could just as easily resulted in catastrophic results. This stock may be a decent longer-term candidate in a portfolio consisting of riskier trades funded with cash not needed for everyday consumption.
Discussion
When measuring the success of our trades, we evaluate the results based on initial goals not on potential results had a different strategy been employed. It is critical to use the most appropriate stocks and options for conservative option strategies like covered call writing and exit strategy implementation must be based on sound understanding of the calculations involved.
***For more information on the mid-contract unwind exit strategy:
The Complete Encyclopedia for Covered Call Writing- classic edition: Pages 264 – 271
The Complete Encyclopedia for Covered Call Writing- Volume 2: Pages 243 – 252
Upcoming events
-March 29th
Quinnipiac GAME Forum
International forum for college and graduate school finance majors
-May 8th
Alan will be hosting a free webinar for the Options Industry Council (OIC) on generating income from selling options. More information to follow.
-May 13th
All Stars of Options
Bally’s Hotel, Las Vegas
10 AM – 10:45 AM
How to Select the Best Options in Bull and Bear Markets
Free event
-May 14th
Las Vegas Money Show
Bally’s/ Paris Hotel
12:15 – 3:15
Master class encompassing covered call writing, put-selling and the stock repair strategy
This is a paid event hosted by The Money Show
Your generous testimonials
Over the years, the BCI community has been incredibly gracious by sending our BCI team email testimonials sharing stories as to what our educational content has meant to their families. Moving forward, we have decided to share some of these testimonials in our blog articles. We will never use a last name unless given permission:
Alan,
I’m in love with covered calls and your system. You have done an excellent job explaining and mapping out your thoughts behind your system and each step.
Anthony W.
Market tone
This week’s economic news of importance:
- Retail sales Jan. 0.2% (0.1% expected)
- NFIB small business index Feb. 101.7 (101.2 last)
- Consumer price index Feb. 0.2% (as expected)
- Durable goods orders Jan. 0.4% (-0.1% expected)
- Producer price index Feb. 0.1% (0.2% expected)
- Construction spending Jan. 1.3% (0.5% expected)
- Weekly jobless claims 3/9 229,000 (225,000 expected)
- New home sales Jan. 607,000 (616,000 expected)
- Industrial production Feb. 0.1% (0.4% expected)
- Job openings Jan. 7.6 million (7.5 million last)
- Consumer sentiment March 97.8 (95.0 expected)
THE WEEK AHEAD
Mon March 18th
- Home builders’ index March
Tue March 19th
- Housing starts Feb.
- Factory orders Jan.
Wed March 20th
- Federal Reserve announcement
Thu March 21st
- Weekly jobless claims 3/16
- Philly Fed index March
- Leading economic indicators Feb.
Fri March22nd
- Markit manufacturing PMI March
- Markit services PMI
- Existing home sales Feb.
- Wholesale inventories Jan.
- Federal budget Feb.
For the week, the S&P 500 moved up by 2.89% for a year-to-date return of 12.59%
Summary
IBD: Market in confirmed uptrend
GMI: 6/6- Bullish signal since market close of January 31, 2019
BCI: I am favoring out-of-the-money strikes 3-to-2 compared to in-the-money strikes for new positions.
WHAT THE BROAD MARKET INDICATORS (S&P 500 AND VIX) ARE TELLING US
The 6-month charts point to mixed market tone. In the past six months, the S&P 500 down 2% while the VIX (12.88) moved down by 1%.
Wishing you the best in investing,
Alan and the BCI team