A collar trade is a covered call trade with a protective put. Jim recently wrote to me asking about the efficacy of also selling an out-of-the-money put to help pay for the cost of the protective put. This article will analyze this series of trades to assess the pros and cons of adding that fourth leg (short put) to our collar trades. We will use Nvidia Corp. (NASDAQ: NVDA) as a real-life example.
The stages of a collar trade + a short put (total of 4 legs)
- 10/9/2018: Buy 100 NVDA at 264.24 (now a long stock position)
- 10/9/2018: Sell 1 x $265.00 call at $14.45 (now a covered call trade)
- 10/9/2018: Buy 1 x $250.00 put at $8.20 (now a collar trade)
- 10/9/2018: Sell 1 x $245.00 put for $6.65 (covered call on the upside and a bear put spread on the bottom side)
Covered call trade- initial calculations
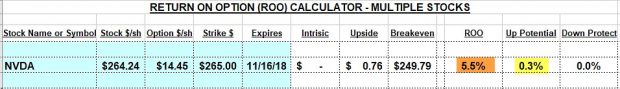
NVDA: Initial Covered Call Calculations
The Ellman Calculator (multiple tab) shows an initial time value return of 5.5% (brown cell)and a total potential 5-week return of 5.8% with upside potential (yellow cell).
Collar calculations adding a protective put

NVDA: Collar Calculations with the BCI Collar Calculator
- The red arrow highlights an initial time value return of 2.37%
- The purple arrow highlights a 2.65% return with upside potential to the call strike
- The green arrow points to a 3.02% maximum loss if share price drops to the put strike or lower
Adding a short put to help fund the cost of the long protective put: Advantage
By generating a premium of $6.65, the $8.20 cost of the protective put is reduced to $1.55. The initial calculations then become
$14.45 – $1.55 = $12.90 = 4.9% (cost basis of $264.24). This more than doubles the collar initial time value return.
Adding a short put to help fund the cost of the long protective put: Disadvantage
By selling the deeper out-of-the-money put ($245.00 strike),we are incurring additional risk to the downside. Once the price moves below the $245.00 strike, we start losing money on that leg of the trade as the strike now is in-the-money and has an intrinsic value component. That risk can be quantified in a worst-case-scenario as follows:
$245.00 – $6.65 = $238.35 per share
Of course, we would take exit strategy steps before letting the trade get that far out of control but the risk should be understood and quantified before entering the trade.
Discussion
When establishing our covered call positions, we must define our personal risk-tolerance and set up our trades accordingly. If we require additional protection to the downside, a protective put is a reasonable approach. Like most insurance policies, we must pay for this protection and our initial results will then decline. If a short put is added to mitigate the cost of the long put, we will then be adding additional risk which is what we were trying to avoid by buying the protective put.
For more information on collar trades:
For access to the BCI Collar Calculator:
April 5th stock report
Will be published late Sunday to early Monday as Barry recovers from his new bionic knee… can’t keep a good man down!
Quinnipiac G.A.M.E. Forum

Alan Speaking to College and Graduate School Finance Majors from the US and Abroad at the NY Hilton
Upcoming events
-May 8th
Alan will be hosting a free webinar for the Options Industry Council (OIC) on generating income from selling options. Click here to register for free.
-May 13th
All Stars of Options
Bally’s Hotel, Las Vegas
10 AM – 10:45 AM
How to Select the Best Options in Bull and Bear Markets
Free event
-May 14th
Las Vegas Money Show
Bally’s/ Paris Hotel
12:15 – 3:15
Master class encompassing covered call writing, put-selling and the stock repair strategy
This is a paid event hosted by The Money Show
Your generous testimonials
Over the years, the BCI community has been incredibly gracious by sending our BCI team email testimonials sharing stories as to what our educational content has meant to their families. Moving forward, we have decided to share some of these testimonials in our blog articles. We will never use a last name unless given permission:
Alan,
My first month using BCI has been awesome. I have already generated $2300 in selling calls and $1600 in stock appreciation. I am trading with $53,000 so returns are amazing. I’ve been trading for 15 years and your methodology is by far the best I’ve seen.
Mark C.
Market tone (***starting in April, market tone information will be located on page 1 of premium member stock reports)
This week’s economic news of importance:
- Chicago Fed national activity index Feb. -0.29 (-0.25 last)
- Housing starts Feb. 1.162 million (1.201 million expected)
- Building permits Feb. 1.296 million (1.317 million last)
- Case-Shiller home price index Jan. 4.3% (4.6% last)
- Consumer confidence index March 124.1 (133.0 expected)
- Trade deficit Jan. -$51.1 billion (-$57.7 billion)
- Weekly jobless claims 3/23 211,000 (222,000 expected)
- GDP revision Q4 2.2% (as expected)
- Pending home sales Feb. -1.0% (4.3% last)
- Personal income Feb 0.2% (0.3% expected)
- Consumer spending Jan. 0.1% (0.3% expected)
- Core inflation Jan. 0.1% (0.2% expected)
- Chicago PMI March 58.7 (64.7 last)
- New home sales Feb. 667,000 (625,000 expected)
- Consumer sentiment index March 98.4 (97.8 expected)
THE WEEK AHEAD
Mon April 1st
- Retail sales Feb.
- Markit manufacturing PMI March
- ISM manufacturing index March
- Construction spending Feb.
- Business inventories Feb.
Tue April 2nd
- Durable goods orders Feb.
Wed April 3rd
- ADP employment March
- Markit services PMI March
- ISM nonmanufacturing index March
Thu April 4th
- Weekly jobless claims 3/30
Fri April 5th
- Nonfarm payrolls March
- Unemployment rate March
- Average hourly earnings March
- Consumer credit Feb.
For the week, the S&P 500 moved down by 0.77% for a year-to-date return of 11.72%
Summary
IBD: Uptrend under pressure
GMI: 5/6- Bullish signal since market close of January 31, 2019 as of Friday AM
BCI: I am favoring out-of-the-money strikes 3-to-2 compared to in-the-money strikes for new positions
WHAT THE BROAD MARKET INDICATORS (S&P 500 AND VIX) ARE TELLING US
The 6-month charts point to a slightly bearish market tone. In the past six months, the S&P 500 moved down 3% while the VIX (13.71) moved up by 14%.
Wishing you the best in investing,
Alan and the BCI team