Quantcast
Channel: Ellman Calculator – The Blue Collar Investor
Viewing all 108 articles
Browse latest View live

In-The-Money Strikes and Covered Call Writing

$
0
0

Option trading basics incorporates fundamental, technical and common sense decisions. One of these, as it relates to covered call writing, is selecting a strike price for the short options position. In bearish and volatile markets I tend to favor the in-the-money strike.

Before I address this matter, let’s review the pros and cons of each type of strike price:

Out-Of-The-Money:

This gives us upside potential in addition to the option return but no downside protection of the initial profit. If we buy a stock @ $28 and sell the $30 call, we have the possibility to earn an additional $2 per share if the equity appreciates from $28 to $30 or beyond. If the stock goes down in value during the 1-month contract period, the profit will be decreased or lost (unless we invoke an exit strategy).

At-The-Money Strike:

This type of strike will normally give us the highest initial option return but offers no upside potential or downside protection. If we purchase a stock @ $30 and sell the $30 call, our option return will be impressive but we will not participate in any share appreciation nor will we have any insurance if the stock declines in value. Bear in mind that when I reference downside protection I am referring to protection of the initial option profit as opposed to the breakeven which is always the entire option premium.

In-The-Money Strike:

Here we receive option profit plus downside protection but no upside potential. If we buy a stock @ $32 and sell the $30 call, we receive an option profit plus protection down to $30. In other words, if our shares depreciate in value from $32 to $30, our option profit is protected. Let’s examine this in more detail. 

Option Value as it relates to Strike price:

In my books and DVDs this matter is discussed under the heading of option basics. An option premium is broken down into two components:

1- Intrinsic Value- The value of an option if it were to expire immediately with the underlying stock at its current price; the amount by which the stock is in-the-money. For these call options, it is the positive difference between the stock price and the strike price. In the above example, it would be $2 (32 – 30). Only in-the-money strikes create intrinsic value.

2- Time Value- The portion of the option premium that is attributable to the amount of time remaining until expiration Friday. Time value = Option premium – Intrinsic value. All strikes have time value (with the possible exception of deep-deep-in-the-money strikes) but at-the-money and out-of-the-money strikes have ONLY time value.

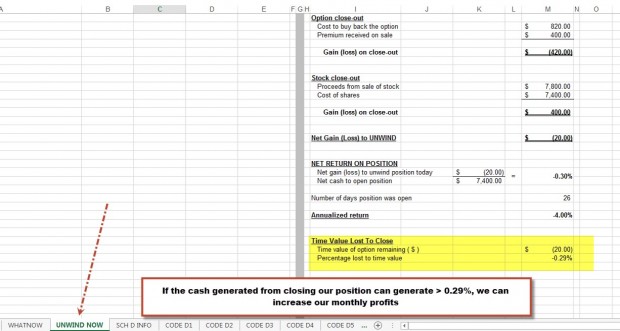
What makes the I-T-M strike so special ?

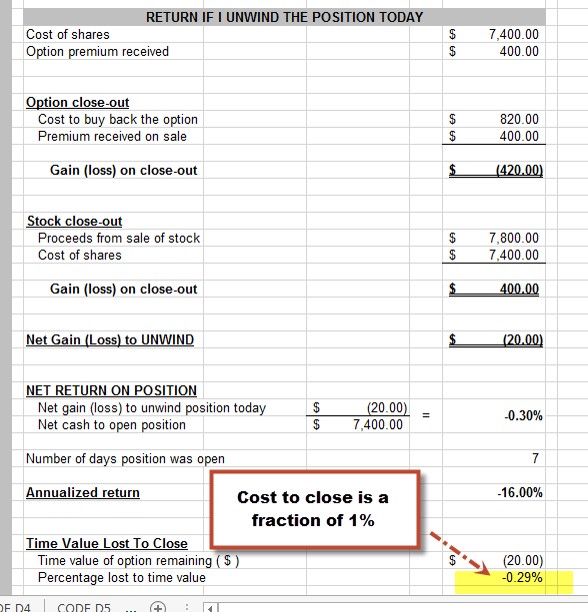
This is the only strike that offers intrinsic value as a component of its option premium. In the above example, if we sell a $30 call on a stock trading @ $32, we receive $2 of intrinsic value to start and then time value on top of that. The time value is our actual profit because if our shares are assigned and sold @ $30 (a strong likelihood), we lose $2 per share on the sale of the stock. Therefore, we do not include the intrinsic value in our profit. However, this money is protecting us from $32 to $30. For my computations, I use this $2 to “buy down” the purchase price of my stock. Instead of saying that I bought a $32 stock and received an option premium of $3.50, I enter it as if I purchased a stock for $30 and received an option premium of $1.50. If we receive an option premium of $3.50 per share when selling the $30 call, there is $2 in intrinsic value and $1.50 in time value. The profit is time value divided by the “bought down” purchase price. It would look like this:

ROO = 150/3000 = 5% 1-month return or 60% annualized.

Downside protection = 200/3200 = 6.3%

Therefore, we are guaranteed a 5% 1-month return as long as our shares do not depreciate by more than 6.3% in that month.

The principles behind selling the in-the-money strike:

Successful covered call writing is not about selecting the only obvious choice using some magical formula that can be employed in every situation. There are many factors to incorporate into our investment decisions and no two scenarios are precisely the same. We can, however, use the Blue Collar mission statement of incorporating sound fundamental and technical principles along with our common sense to come to intelligent and informed conclusions. Think of yourself as the artist who incorporates his well-thought-out strokes into an eventual masterpiece. How many Picassos are created with a paint-by-the-numbers kit?

I view an I-T-M strike as an option with an insurance policy. Now this policy is free  but it does eliminate an opportunity. It’s free because the option buyer is paying for it when we sell the call. The opportunity lost is any potential for share appreciation. So when would the odds favor us to opt for the I-T-M strike versus the O-T-M strike? Here are the situations when I am most likely to sell an I-T-M strike:

1- An extremely volatile or declining market

2- Technical analysis of the stock demonstrates mixed indicators.

3- An uptrending chart pattern but in a volatile manner  (the Scouter Rating will eliminate many of these- see page 31 of Encyclopedia….).

4- Part of my laddering of strikes procedure: even in normal markets I will incorporate some I-T-M strikes as a way to diversify strikes.

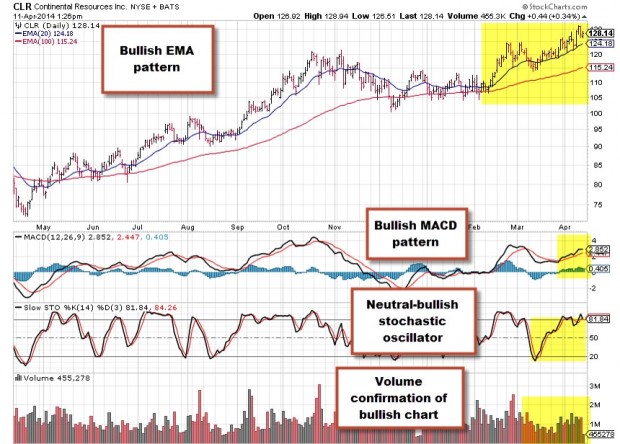
Real life example- EBAY

EBAY is a stock currently on our premium watch list (August, 2012).  The technical indicators show a positive chart pattern but with mixed to negative confirming indicators. Here is the current chart:

EBAY chart showing a mixed technical picturene

EBAY price chart

The current market value is $44.05.  The stock technicals are mixed and the market tone is cautiously bullish. Those with low risk-tolerance (I’m guilty as charged) may opt for the $42 or $43 in-the-money call. Let’s work out the calculations. Since there is only one week remaining until the August options expire, let’s look at the September calls:

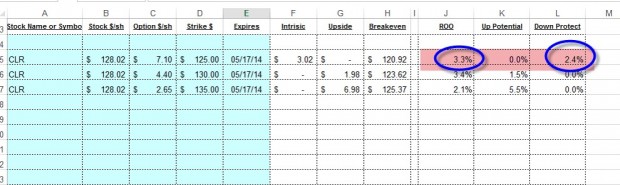
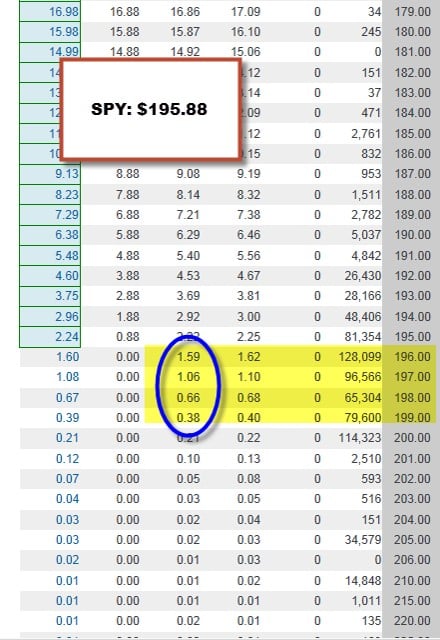
In-the-money strikes: Accessing the options chain:

Strike price selection

EBAY options chain


Calculating returns for the $42 and $43 in-the-money strikes: The Ellman Calculator Single Tab:

Options calculations

The Ellman Calculator- Single tab


Calculation results:

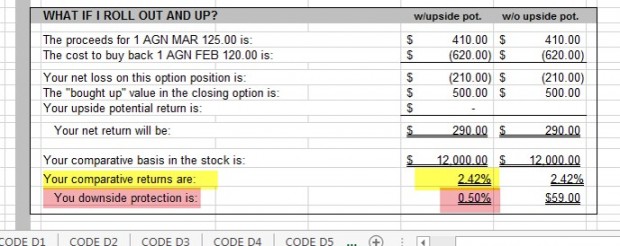
Yellow field: The $42 strike yields a 2.2%, 5-week return with a downside protection of 4.7%.

Green field: The $43 strike yields a 3.0%, 5-week return with a 2.4% downside protection.

Many of our readers have asked why I have been highlighting mainly I-T-M strikes of late. The reason has to do with the extreme market volatility and the fact that I am a conservative investor with low risk tolerance. More aggressive investors might opt for the O-T-M strike. There is no right or wrong as long as you are making an informed decision factoring in and understanding all available information. Remember that all these calculations are done for you automatically using the Ellman Calculator.

Conclusion:

Strike selection is based on several factors including general market assessment, chart technicals, and personal risk tolerance. The in-the-money strike should be considered in volatile and bearish market environments and when technicals are mixed. Those with lower risk tolerance will generate additional downside protection that may be more suitable to their investment needs.

Upcoming live events:

September 14th, 2012: Forex and Options Traders Expo/ Paris Hotel, Las Vegas. Register FREE:

http://www.moneyshow.com/tradeshow/Las_vegas/forex/speakers/speaker_listing/

November 10th, 2012: Chicago Chapter AAII/ University Club, Chicago

April 20th, 2013: Atlanta Options Investor Club/ Georgia State University, Alpharetta, Georgia

September 17th, 2013: Philadelphia Chapter AAII/ Plymouth Meeting, Pennsylvania

Market tone:

This week’s economic reports raised hope for stronger economic growth:

  • The Labor Department reported initial jobless claims @ 361,000, 6,000 less than expected
  • Consumer credit (the level of consumer credit is considered a barometer of consumers’ financial health and an indicator of potential spending patterns) grew $6.5 billion in June, less than the $11 billion anticipated
  • The US trade gap decreased from $46 billion to $42.9 billion in June. It was the 3rd consecutive monthly decline and a positive sign for improved GDP growth
  • Non-farm productivity, which measure worker output/hour, rose at an annual rate of 1.6% in the 2nd quarter (a rise of 0.5% was expected) after a 0.5% decline in the 1st quarter

 For the week, the S&P 500 rose by 1.1% for a year-to-date return of 13.3% including dividends.

Summary:

IBD: Confirmed uptrend

BCI: Moderately bullish and adding to my out-of-the-money positions

Thanks for your interest and support of our BCI methodology,

Alan (alan@thebluecollarinvestor.com)

www.thebluecollarinvestor.com


Selecting The Best Strike Price

$
0
0

In last week’s article concerning option trading basics I highlighted the in-the-money strike in our covered call writing strategy. In this article I will expand our options calculations to all three types of strike prices. First, let’s review each of these categories:

Out-Of-The-Money-Strike Prices:

There is a reason why these are  popular strikes for many investors. When an option is sold, we generate an option premium that is ours to keep no matter what happens to the stock or whether that option is ultimately exercised. In the case of an O-T-M strike, we have an opportunity to make additional profit on stock appreciation. For example, if we buy 100 x XYZ @ $28 and sell the $30 call, we can generate an additional $200 on the sale of the stock (28 to 30 times 100). When we sell at-the-money or in-the-money strikes, there is NO CHANCE of such additional profits (additional capital can be made via exit strategies but that’s an article for another day). So from a profit perspective, O-T-M strikes are more attractive. Blue Collar Investors love profit but understand that it is only part of the big picture. Not factoring in risk is a major error that many covered call sellers make and in my view is what separates the men (women) from the boys (girls).

In-The-Money Strike Prices:

An example would be if we buy a stock for $32 and sell the $30 call. We are obligated to sell our shares for $30 per share. If the equity goes from $32 to $40, we make no additional income due to our obligation to sell @ $30. The option premium we receive from the sale of this option has an intrinsic value of $2 (32 – 30). The remaining option premium is time value and our true profit (ROO). However, the $2 additional premium we receive from this I-T-M strike will give us downside protection. For example, if we sell the $30 call for $3.50, we deduct the $2 of intrinsic value for an option profit of $150 per contract. This represents a 5% return. This profit is fully protected as long as our shares do not decline below $30. This $200 per contract represents a 6.3% downside protection. In other words, we are guaranteed a 5% 1-month return as long as our stock price does not decline by more than 6.3%.

At-The-Money Strike Prices:

When the strike price sold is the same as or close to (near-the-money strike) the current market value of the security it is said to be at-the-money. These strikes return the greatest initial option returns but offer no upside potential or downside protection of the initial profit. It is a bullish position to take.

Factors that determine which strike to sell:

1- Your risk tolerance: If you can’t sleep at night when your portfolio value declines, opt for the I-T-M strikes that offer more downside protection. Be sure not to complain if your shares appreciate!

2- Market Tone: In an uptrending and stable market environment, O-T-M or A-T-M strikes make sense to take advantage of share appreciation and/or initial returns.  In a volatile or bearish market, I tend to favor I-T-M strikes.

3- Technical Analysis: The stronger the chart pattern of a stock, the more likely I am to sell an O-T-M strike. This would involve uptrending moving averages with all confirming indicators (see Chapter 4 of my Encyclopedia for Covered Call Writing).

Laddering of Strike Prices:

Laddering is an investment technique whereby investors purchase multiple financial products with different maturity dates. For example, when I purchase bonds (boring!!!!), I may buy 1,2,3,4 and 5 year maturations. This will protect me from interest rate risk. I have borrowed this term and applied it to strike prices. Each month, I will try to have a mix of I-T-M, A-T-M and O-T-M strikes. In a favorable market environment, I will lean towards more O-T-M. In a volatile or declining market, more I-T-M strikes. This is just another way of throwing the odds in our favor. It’s not a guarantee but rather a smart,  sophisticated approach to cc writing that few others even think about, never mind actually employ.

Real life example (HITK: February, 2010):

Options Chain:

Strike price selection

HITK: options chain

Let’s look at the following strikes:

  • ITM $20
  • ATM (near-the-money) $22.50
  • OTM $25

Next, let’s feed this information into the single tab of the Ellman Calculator:

Strike price selection and The Ellman Calculator

The Ellman Calculator- single tab


Now let’s review the results that will guide us to the best covered call decisions:

Calculating strike selection returns

The Ellman Calculator: returns for HITK

One month returns

$20 ITM strike (red):

  • ROO = 3.8%
  • 10.5% protection of that profit

$22.50 ATM (near-the-money) strike (green):

  • ROO = 7.6%
  • Upside potential (minimal) = 0.7%
  • No downside protection of initial profit

$25 OTM strike (blue):

  • ROO = 3.6%
  • Upside potential = 11.9%
  • No downside protection of the option profit

Conclusion:

When determining which is the best strike price to utilize for cc writing we must factor in several parameters. Market assessment, chart technicals and personal risk tolerance are the three most important parameters to consider when making these investment decisions.

New event planned:

In addition to the live events listed in last week’s article I will be appearing in Milwaukee, Wisconsin on Saturday, January 19th. Details to follow.

Market tone:

There were several positive signs coming from this week’s economic reports:

  • Industrial production (output of nation’s factories, mines and utilities) rose 0.6% in July, better than the 0.5% expected
  • The Producer Price Index (a measure of the average change over time in the selling prices of a fixed basket of goods by stage of production, industry, and commodity. It is considered a leading indicator for consumer inflation) or PPI rose by 0.3% in July higher than the 0.2% anticipated
  • Business inventories (a gauge of the number of months it would take to deplete existing inventories at the current rate of sales, which is an important indicator of the near-term direction of production activity) rose 0.1% in June, down from the 0.3% in May
  • The Conference Board’s index of leading economic indicators increased by 0.4% in July, doubling the figure predicted. This bodes well for future economic activity although most economists still predict slow growth through the end of 2012
  • Retail sales rose a whopping 0.8% in July after declining in April, May and June. A rise of 0.3% was expected
  • New home starts dropped by 1.1% in July after a strong rise in June but housing starts were still 21.5% higher than a year ago
  • New building permits (indicator for future homebuilding) rose by 6.8%, the largest increase since 2008
  • Housing completions rose by 7.1%

For the week, the S&P 500 rose by 0.9% for a year-to-date return of 14.4%, including dividends.

Summary:

IBD: Confirmed uptrend

BCI: Moderately bullish slightly favoring out-of-the-money strikes

With much appreciation for your continued support,

Alan (alan@thebluecollarinvestor.com)

www.thebluecollarinvestor.com

Ask Alan – Using the Nasdaq 100 (QQQ) for Covered Call Writing

$
0
0

Alan answers a question from Joe of Dallas, Texas. Joe asks:

“I just finished reading Cashing in on Covered Calls and loved it! In the book you mention that you used the Qs in your mother’s account. Do you still recommend this ETF for those just started out with limited capital?”

If you want more “Ask Alan” videos, you can view the archive.

Additionally, to get our freshest content (like “Ask Alan”), be sure to like us on Facebook or Subscribe to our Weekly Newsletter:


More Video:


To enter your questions to “Ask Alan”, fill out the form on the contact page. Be sure to begin your message with “ASK ALAN”.

Ask Alan – When calculating time value, do we use the bid, ask or last prices?

$
0
0

Alan answers a question submitted by Bill from Pittsburgh, PA, who asks:

“What is the best price to use when calculating the percent remaining time value in a covered call; the bid, the ask, or the last?”

If you want more “Ask Alan” videos, you can view the archive.


More Video:


To enter your questions to “Ask Alan”, fill out the form on the contact page. Be sure to begin your message with “ASK ALAN”.

Setting Up Your Covered Call Portfolio Using The Ellman Calculator

$
0
0

Covered call writing involves options calculations…there’s no getting around it!  It’s been a while since we talked math. What’s with all the frowns? Mastering and understanding the calculations (The Ellman Calculator will do all the work) will enhance our bottom lines…more cash in our pockets. With that in mind, let’s set up a hypothetical portfolio of 5 securities with a cash available reserve of $50,000.

Since our system requires cash, stock and industry diversification, we will look to purchase 5 securities in 5 different industries and allocate approximately $10k per equity. I turned to a previous premium watch list for eligible securities and (randomly, these are not recommendations) selected 4 stocks and 1 exchange-traded fund from our premium reports. Here are the securities with industry and price:

  • PVH- apparel: $74.63
  • GSM- Metals: $24.50
  • HAL- Energy: $56.97
  • EBAY- Retail: $33.32
  • ICF- Real Estate ETF: $76.28

I compute the number of shares to purchase by first dividing $50k by 5 (stocks) and allocating approximately $10k per equity. We must also be sure to leave a small balance for possible exit strategy execution. We then divide the price-per-share into $10k and round to the nearest “100″ (there are 100 shares per contract). This is called cash allocation. Our portfolio will look something like this:

  • PVH: 100 shares
  • GSM: 400 shares
  • HAL: 200 shares
  • EBAY: 300 shares
  • ICF: 100 shares

This represents a total investment of $46,291 leaving about $3700 for possible exit strategy executions.

Next we turn to our options chains and look to the nearest strikes prices, both in, at, and out-of-the-money. We enter the information in the “multiple tab” of the Ellman Calculator”. Here are the statistics entered into the calculator at the beginning of the contract cycle: 

Calculating covered call writing returns

Ellman Calculator


The beauty of this calculator is that it will assist us in making our investment decisions based on our market assessments and chart technicals. We must also factor in our personal risk tolerance (if  low, favor in-the-money strikes). If we are bullish on the stock and overall market, we look to garner the highest ROO (return on our option) and upside potential (out-of-the-money strikes). If we are bearish or concerned in any way, we look to get the additional downside protection of an in-the-money strike. In the chart above, I highlighted in yellow the choices we would favor if we were bearish. We can generate a 2%, 1-month return with some excellent downside protection.

I also highlighted in green, some bullish choices we would consider where the return and potential return of share appreciation are greater but with little or no downside protection of the initial option profit (time value of the premium). Please remember that downside protection in the BCI methodology represents protection of the option profit, not the breakeven.

If we wanted to generate the greatest initial return, we would look to the selections where I placed the red arrows. The chart below demonstrates such initial returns:


Covered call writing profits

Initial covered call returns

Note that for EBAY the strike was slightly in-the-money so we deduct the intrinsic value from the premium before calculating our initial option return.

Once we have selected our stocks and sold our options and placed them in our portfolio manager (organized lists), we begin the process of managing these positions for possible exit strategy executions. This will not take a lot of our time. There is a learning curve to covered call writing but once mastered, it becomes second nature and a great way to invest and become financially independent for many Blue Collar Investors.

To learn more about our premium reports:

http://www.thebluecollarinvestor.com/membership/

For a FREE copy of the Basic Ellman Calculator click on the “free resources” link at the very top of each of our site web pages.

My Next Speaking Engagement:

March 21, 2013 6:00 pm –  9:00 pm

South Florida Options Trading Meetup


***Because of you, our recent webinar in conjunction with The Money Show was a smashing success with a huge attendance and wonderful feedback. Thanks to all of our members whom participated.

Market tone

As our stock market reaches an all-time high good news regarding employment took center stage in the past week’s economic reports: 

  • According to the Labor Department, the unemployment rate declined to 7.7% in February, a post-recession low 
  • Non-farm payrolls showed 236,000 jobs added in February well above the 171,000 expected 
  • The average number of jobs added over the past 3 months was 191,000 which economists believe is adequate to result in meaningful decreases in the unemployment rate 
  • The ISM nonmanufacturing index (an indicator of overall service-sector trends, based on a survey of several hundred purchasing and supply executives in a variety of nonmanufacturing industries. A reading above 50 indicates that the nonmanufacturing economy is generally expanding; below 50, that it is generally declining) increased in February to 56, a 1-year high 
  • Core capital goods orders rose by 7.2% to a 45.6% annualized growth in the 3 months ended in January, the 2nd highest advance since 1992 
  • According to the Federal Reserve’s March Beige Book report the economy continued to advance from mid-January to early February driven to a great extent by home sales and construction 
  • The US trade deficit rose to $44.4 billion, higher than the $42.6 billion anticipated 
  • 4th quarter GDP rose only 0.1% due to a 1.9% decline in nonfarm business productivity 
  • Consumer credit (a report of the dollar value of consumer debt, including categories such as credit card use and store charge accounts (known as revolving debt) as well as longer-term loans for autos, education, recreation vehicles, etc. (known as nonrevolving debt). The level of consumer credit is considered a barometer of consumers’ financial health and an indicator of potential spending patterns) rose by $16.2 billion in January

For the week, the S&P 500 rose by 2.2%, for a year-to-date return of 9%, including dividends.

Summary:

 IBD: Confirmed uptrend

BCI: This site continues to have a bullish outlook but remains conservative in its investment approach until the “sequester” issue has been addressed. Global, economic and political events can disrupt a bull market even temporarily and so caution is appropriate in the eyes of this investor. As a result, despite our bullish stance we are slightly favoring in-the-money strikes in our investment choices.

Your support and loyalty is greatly appreciated and never overlooked.

My best to all,

Alan (alan@thebluecollarinvestor.com)

www.thebluecollarinvestor.com


Covered Call Writing: The Case For 1-Month Options

$
0
0

I sell predominantly 1-month options when selling covered calls. This decision was NOT based on anything I read or was told, but rather on experience and common sense. Most stocks with options have at least four expiration cycles affiliated with them at any point in time…the current month, the next month and two more months further out based on the particular option cycle that the equity has been assigned to. Stocks that also have LEAPS (long-term options) have more than four cycles. Add to that the newer weekly and quarterly expirations and we have a lot of options to choose from. Using the options chains and The Ellman Calculator, I will make my case for selling mainly 1-month options (weeklys are also currently being studied by the BCI team as more equities are being added to the “weekly pool”).

            Three Reasons to Sell One-Month Options  

1- It facilitates adhering to a core BCI guideline of never selling an option in a contract cycle that has an upcoming earnings report. Since earnings reports are made public on a quarterly basis for U.S. companies, selling short-term options allow us to move our stocks in and out of our portfolios (yet keep them on our watch lists if they still meet our system criteria).

2- Stocks have no loyalty to us. They can be our best friends one month and our worst enemies the next. Although we do have exit strategies to help control a negative situation, the shorter the commitment we have to an equity, the less risk we incur.

3- We make the most money selling one-month options. I’m sure I have your attention now, so allow me to demonstrate via an options chain for Netlogic Microsystems (NETL), trading at the time of this writing for $53.22 as shown in the chart below:

NETL price

The option chain is shown in the chart below:

NETL Options Chain

This information was captured after the February contracts expired. We will hone in on the March (one-month out), April (two-months out) and July (five-months out) contracts. Here is the information we glean from the options chain and will feed into the Ellman Calculator (single tab):

  • The stock was trading @ $53.22 so we will look at the out-of-the-money $55 call options
  • The March $55 call returned $1.65/share (red circle)
  • The April $55 call returned $2.55/share (blue circle)
  • The July $55 call returned $4.70/share (green circle)

It may be tempting to opt for the higher dollar returns of the longer-term options; however we must factor in the time frame and logically deduce how to best put our money to work so as to generate the most profits. So let’s feed this information into the single tab of the Ellman Calculator, as illustrated below:

The Ellman Calculator

Now, in the chart below, let’s examine the results of these calculations:

                            Option calculations: NETL- 1, 2 and 5 Month Returns

The ROO (initial option returns) or percentage returns generated does NOT include the upside potential. Although the Ellman Calculator does give this information, I left it out of this graphic because all choices have the same upside, and I want to concentrate just on the initial option profit. Here are the ROO figures derived from the Ellman Calculator:

  • The March $55 call returns 3.1% (green arrow)
  • The April $55 call generates 4.8% (blue arrow)
  • The July $55 call generates 8.8% (red arrow)

Once again, upon first glance it appears that the July $55 call will be the most lucrative for us until we annualize these percentages. To do so, we must convert these figures to a monthly return and multiply by 12, as follows:

  •    March: 3.1%/1 x 12 = 37.2%
  •    April: 4.8%/2 x 12 = 28.8%
  •    July: 8.8%/5 x 12 = 21.1% 

The one-month options outperformed the two-month options by more than 29% and the five-month options by more than 76%! I rest my case.

***For a FREE copy of the Ellman Calculator and user guide send me an email @: alan@thebluecollarinvestor.com

Include your name and email address with the words “request Ellman Calculator”. The calculations are precisely the same as described in my books and DVDs.


NEXT LIVE SEMINAR:

April 20th in Atlanta. Those who received an email stating the next presentation on 3-21 please note that this event already passed.

Market tone:

This week the S&P 500 surpassed its previous record high from October, 2007. The positive market forces are supported by strong corporate earnings, positive weekly economic reports (outlined each week in this blog), strengthening housing stats and increasing employment figures:

  • 4th quarter GDP was revised upward from (-) 0.1% to +0.4% due to better-than-expected business spending and exports
  • Real GDP growth for 2012 came in @ 2.2% more than the 1.8% for 2011
  • The Conference Board’s index of consumer confidence (a gauge of consumers’ attitudes about the present economic situation as well as
    their expectations regarding future conditions. Consumer confidence tends to have a strong correlation with consumer spending patterns) dipped by 8.3 points to 59.7 in February. This appears due to the uncertainty created by the recent sequester
  • Durable goods orders (a measure of the number of orders for a broad range of products—from computers and furniture to autos and defense aircraft—with an expected life of at least three years. Durable-goods orders are a leading indicator of industrial production and capital spending. Data fluctuate widely from month to month and are often subject to significant revision) increased by 5.7% much higher than the 3.8% anticipated
  • Initial jobless claims for the week ending March 23rd came in at 357,000 higher than the 340,000 expected
  • New home sales in February came in at an annualized rate of 411,000 representing the second time sales were above 400,000 since April, 2010. This represents a 12.3% rise from the year earlier
  • The 4.4 month supply of new homes at current sales rates are near historical lows
  • The median price of new homes rose by 2.9% year-to-year to $246,800

For the week, the S&P 500 rose by 0.8% for a year-to-date return of 10%, including dividends.


Summary:

IBD: Confirmed uptrend

BCI: Moderately bullish (love the housing news!) but remaining cautious as the impact of the sequester is difficult to quantify. This site is still slightly favoring in-the-money strikes.

Happy holidays to one and all,

Alan and the BCI team (alan@thebluecollarinvestor.com)

www.thebluecollarinvestor.com

Ask Alan – Is It Too Expensive To Buy Back The Options When The Stock Price Increases?

$
0
0

Alan answers a question posed by Al from Melbourne, Florida. who asks:

“One of my first option choices was to sell 5 positions on HTZ with a strike price of $20. When I opened the position, HTZ was trading at $21.06 per share, and I received the premium of $1.40 per share when I sold to open on March 22nd. The stock has been moving upward since I purchased it and today was trading at $23.49. Now, the strike price is pretty deep in-the-money so I tried to input the data into the (Elman) Calculator to see if it makes sense to unwind the position, but I’m not sure that I’m interpreting it correctly. It appears that it would cost me $350 per share to buy back the option. What is your read on this?”

If you want more “Ask Alan” videos, you can view the archive.


More Video:


To enter your questions to “Ask Alan”, fill out the form on the contact page. Be sure to begin your message with “ASK ALAN”.

Ask Alan – How Do We Make Use Of Intrinsic Value

$
0
0

Alan answers a question shared by Keith, who asks:

“Do we care about intrinsic value when selecting and exiting stocks? If so, what is the best way to calculate and make use of it?”

If you want more “Ask Alan” videos, you can view the archive.


More Video:


To enter your questions to “Ask Alan”, fill out the form on the contact page. Be sure to begin your message with “ASK ALAN”.


Ask Alan – Using Stocks With Mixed Technicals

$
0
0

Alan answers a question shared by Adrian and others, who ask:

“Do you think I should buy shares if the technicals are mixed and are not ‘bold-listed’ stocks in your Premium Stock Reports?”

If you want more “Ask Alan” videos, you can view the archive.


More Video:


To enter your questions to “Ask Alan”, fill out the form on the contact page. Be sure to begin your message with “ASK ALAN”.

Achieving The Highest Covered Call Writing Returns Using The Blackjack Analogy

$
0
0

Covered call writers and all investors using stock options strategies have one thing in common: we all want to achieve the highest possible returns within the framework of our own personal risk tolerance. The focus of this site and The Blue Collar Investor is to provide the education and to share ideas that will help achieve these goals. Education is power and that is our starting point but where do we go from there? In this article, I will focus on the thought process that can be used to become an elite covered call writer and how it reminds me of the casino game of blackjack.

Recently, Mark T. wrote to me with a valid question: If I achieve a 2% return on the sale of my option and one of my trades turns against me, I will end up with less than a 2% return…should my goal be higher than 2% to end up with that goal? So the question becomes how can we generate an initial return and protect and manage our positions such that it will coincide with our final returns or at least as close as possible. The answer lies in throwing the odds in our favor in ways that few covered call writers ever think of. Let’s turn to blackjack first just for the fun of it. I am no expert in this card game but when I do play, I have all the charts memorized. That tells me that given my 2 cards and dealers one up card, what the computers say is the best play…take a card, stand pat, split, double down. If we have a 2-card total of 11 and the dealer is sitting with a 6, we double down (double our bet) and take advantage of a situation where we can increase our returns. If we are sitting with a 6 against a dealer’s ace, we take a card hoping to improve a losing situation. Each situation is handled on its own merit as we strive to move the odds in our favor and much like covered call writing, it all starts with education. The major difference between these two strategies is that covered call writers will make money in the long run and most blackjack players will lose money. The main point here is that Blue Collar Investors must take advantage of all aspects of our BCI methodology to throw the odds in our favor and that is what will make us elite covered call writers.

The 3 aspects of the strategy that will give us opportunities to generate the highest possible returns are:

  • Stock selection
  • Option selection
  • Position management

By selecting the best performing underlying securities from fundamental, technical and common sense perspectives, we begin the process of throwing the odds in our favor. Option selection is based on overall market assessment, personal risk tolerance and chart technicals. Let’s look at a real-life example for KORS, a stock on our Premium Stock List at the time I am penning this article. With KORS trading @ $95.56, here is the options chain for March, 2014, a 5-week return:

Covered call writing and strike price selection

KORS options chain 2-14

We will evaluate the in-the-money $92.50 and $95 strikes as well as the out-of-the-money $97.50 and $100 strikes as we feed these stats into the “multiple tab” of the Ellman Calculator (free in the “free resources” link @ the top black bar on this site):

Calculating covered call writing returns

The Ellman Calculator

Now it’s time to throw the odds in our favor. In a bull market environment with chart technicals favorable, we are sitting with an 11 against the dealer’s 6. Time for an out-of-the-money strike. These will generate excellent initial returns (2.9% and 2% in yellow field) but also give us the opportunity for additional income streams from share appreciation (2% and 4.6% more in pink field). This is like doubling down in blackjack or taking advantage of a favorable situation to elevate our returns.

In a bear market environment or with chart technicals mixed, we need an insurance policy to protect our capital. We are sitting with a 6 against the dealer’s ace. We throw the odds in our favor by selling an in-the-money strike, both of which return decent initial option profits (2.5% and 3.6% in yellow field) and one (the $92.50 strike in brown field) offers decent protection of that option profit. So what we have accomplished here is to generate some protection against a potential losing trade and to enhance profit potential for winning trades and this will allow us to achieve our goals in normal market conditions.

We are not finished yet because we haven’t started to execute our exit strategy opportunities. Some (“hitting a double”, the “mid-contract unwind”) will allow us to generate a 2nd income stream in the same month with the same cash) and others (like rolling down or closing the entire position) will allow us to mitigate losses. These strategies are discussed in detail with examples in my books and DVD Programs.

Throwing the odds in our favor and taking advantage of opportunities are factors that distinguish Blue Collar Investors from all the others. When we’re sitting with a 16 against the dealer’s ace we do not sit there like a deer in headlights with sweat pouring down our foreheads…we take a card. There may not be a great play all the time but there is always a best play and it’s all about throwing the odds in our favor like nobody’s business (an expression my mother uses).

Next live seminar:

NEW YORK

Long Island Stock Traders Investment Group

Monday, March 10th

6:45 PM – 9:30 PM

Plainview Old Bethpage Library 

999 Old Country Rd, Plainview, NY


Date change:

My seminar in Orange County California has been moved from June 7th to June 14th. Details and link to register to follow


 Market t0ne:

New Fed Chairwoman, Janet Yellen, re-affirmed her commitment to continue the course to slowly decrease the government’s bond-buying program as the economy improves. This week there were only a few economic reports and they were rather unimpressive perhaps due to extreme weather conditions throughout the country:

  • The second estimate for Real Gross Domestic Product for the 4th quarter, 2013 is projected to be 2.4% annualized, lower than expected (2.5%). This is well below the 4.1% reading for the 3rd quarter
  • This revised data now puts GDP growth @ 1.9% for 2013, less than the 2.8% for 2012 and slightly higher than the 1.8% reading for 2011
  • New orders for durable goods (a measure of the number of orders for a broad range of products—from computers and furniture to autos and defense aircraft—with an expected life of at least three years. Durable-goods orders are a leading indicator of industrial production and capital spending. Data fluctuate widely from month to month and are often subject to significant revision) fell by 1.0% in January, less than the 1.7% projected by analysts
  • The Conference Board’s Consumer Confidence Index (a gauge of consumers’ attitudes about the present economic situation as well as their expectations regarding future conditions. Consumer confidence tends to have a strong correlation with consumer spending patterns) dropped to 78.1, below the 80.3 expected
  • Sales of new single-family homes surprisingly rose by 9.6% in January to an annualized post-recession high of 468,000 units while analysts were anticipating 400,000 units. This was increase of 2.2% year-to-year
  • The median price of new single-family homes was 3.4% higher, also year-to-year

For the week, the S&P 500 rose by 1.0%

Summary:

IBD: Confirmed uptrend

BCI: Cautiously bullish favoring out-of-the-money strikes 3-to-2

My best to all,

Alan (alan@thebluecollarinvestor.com)

www.thebluecollarinvestor.com


Ask Alan – How Do We Calculate Upside Potential?

$
0
0

Alan answers a question shared by William, who asks:

“I appreciate the spreadsheets you sent especially the calculator. I have pretty much figured out all of the calculations except the line-item “Your Potential Upside Return” Can you help me understand what “Your Potential Upside Return” means and how it is calculated?”

If you want more “Ask Alan” videos, you can view the archive.


More Video:


To enter your questions to “Ask Alan”, fill out the form on the contact page. Be sure to begin your message with “ASK ALAN”.

Option Premiums: How Intrinsic Value Protects Time Value

$
0
0

Meaningful option calculations are essential in determining if the premiums meet our goals. To this end, we must understand the mathematics of these calculations to become elite covered call writers. Now don’t worry…we don’t have to become Albert Einstein to be successful. But we do have to have a general understanding of the components of the option premium and how they influence our investment decisions.

Let’s start with the basic equation that many of you have seen in my books and DVDs:

Option premium = intrinsic value + time value

Intrinsic value applies only to in-the-money strikes and is the amount the strike price is below the current market value. As an example, if we bought Company BCI for $32 and sold the $30 call for $3, of that $3, $2 is intrinsic value (NOT profit) and $1 is time value (our true initial profit). Now, at-the-money and out-of-the-money strikes have premiums associated with them that are all time value since the strike price is not in-the-money. Examples:

  • At-the-money: Buy BCI for $30 and sell the $30 call
  • Out-of-the-money: Buy BCI for $28 and sell the $30 call

In this article, I will discuss and show hypothetical and real life examples of how intrinsic value protects time value when selling in-the-money strikes.

Hypothetical example

  • Buy BCI @ $32
  • Sell $30 call @ $3
  • Intrinsic value = $2
  • Time value = $1
  • Initial profit = $1/$32 – $2 = 3.3%

Since we only count $1 of the $3 premium as initial profit and we did, in fact, receive a total of $3, what happened to the other $2? We use it to “buy down” our cost basis from $32 to $30. This means we are guaranteed our 3.3%, 1-month return as long as share depreciation does not drop from $32 to below $30. I call this downside protection which is quite different from breakeven. It is protection of the initial profit. It is calculated as follows:

Downside protection = $2/$32 = 6.3%

I view the downside protection as an insurance policy which is paid for by the option buyer. When evaluating this trade, the calculations tell us the following:

We are guaranteed a 3.3%, 1-month return as long as share value does not decline by more than 6.3% by expiration. If that trade meets your goals then it’s time to make some money.

As an aside, to calculate breakeven we deduct the entire option premium from the initial cost:

$32 – $3 = $29

Real-life example: MYGN 

At the time I am writing this article, Myriad Genetics (MYGN) is a stock on our Premium Watch List and the options chain shows the following stats with 3-weeks remaining until expiration:

  • Price = $36.21
  • $35 strike = $2.30
  • Therefore, time value = $1.09 and intrinsic value = $1.21

Let’s allow the “multiple tab” of the Ellman Calculator (for a free copy, click on the “free resources” link at the top of this page) to do the work for us:

covered call writing calulations

Intrinsic value protects time value

The calculator shows that we are guaranteed a 3.1%, 3-week returns as long as share value does not decline by more than 3.3% by expiration. One of the many perks of being a covered call writer is that this “insurance policy” is paid for by the option buyer, not by us.

Summary

When using in-the-money strikes, the intrinsic value protects the time value or our initial profit. These strikes are most appropriate in bearish or volatile markets, when chart technicals are mixed and when the investor’s risk-tolerance is extremely conservative.

Next live seminar:

Arizona Point Options Group

Tuesday April 8th, 2014

7:15 – 9:15 PM

Rio Salado College Conference Center

2323 W. 14th St

Tempe, AZ 85281


Market tone:

Economic news this week was slightly positive despite to impact of harsh weather conditions. The Federal Reserve Board also had its first meeting with newly-appointed Chairwoman, Janet Yellen:

  • The Fed maintained to hold its stance on short-term interest rates @ 0% – 0.25% but moved away from tying the decision solely to inflation and unemployment (6.5% level). It will now use a “wide range” of factors in its policy-making decision of interest rates
  • The Fed acknowledged a slower housing recovery but improvement in the labor market, business investment and household spending
  • The Fed also announced that it would cut back its bond-buying program by $10 billion to $55 billion per month. This reflects confidence in the overall economy
  • New home construction dropped by 0.2% in February, more than projected but less severe than in December and January
  • Single-family starts rose by 0.3% whereas multi-family starts decreased by 1.2%, both improvements from December and January
  • Sales of previously-owned homes dipped by 0.4% in February slightly below forecasts
  • Year-to-year, housing starts are down by 6.4% whereas permits are up 6.9% and home c0mpletions are up 21.9%
  • Industrial production (a measure of the changes in quantity of physical materials and items produced in the manufacturing, mining, and utilities industries) increased by 0.6% in February, driven mainly by a 0.8% rise in factory output. This doubled the stats expected by analysts. February’s total production is up 2.8% year-to-year
  • The Consumer Price Index (CPI), a measure of inflation) rose by 0.1% in February, below analysts’ predictions re-affirming that inflation is under control
  • Inflation is up 1.1% year-to-year
  • The Conference Board’s index of leading economic indicators ( a measure of economic outlook over the next 6 months) rose by 0.5%, better than the 0.4% projected by analysts
  • The coincident index (current economic activity) rose by 0.2% in February
  • The lagging index was up 0.3%

For the week, the S&P 500 was up 1.4% for a year-to-date return of 1.4%, including dividends.

 Summary:

 IBD: Uptrend under pressure

BCI: This site is cautiously bullish but because of geo-political events (Ukraine) and concerns regarding globalization (China), we continue to favor in-the-money strikes 3-to-2.

My best to all,

Alan (alan@thebluecollarinvestor.com

www.thebluecollarinvestor.com

Exit Strategy Calculations vs. Final Calculations

$
0
0

Mastering options calculations is an essential skill needed to attain the very highest covered call writing returns. Although the Ellman Calculator will do most of the heavy lifting for us, understanding the reasons behind these calculations and when and how to apply them, will make us all more skilled investors.

Recently a BCI member sent me a hypothetical trade that involved two of our exit strategy choices: rolling down and the mid-contract unwind exit strategy. Let me first define:

Rolling down: Closing out options at one strike and simultaneously opening another at a lower strike price.

Mid-contract unwind exit strategy (MCU): Closing an entire covered call position mid-contract when the time value of the premium approaches zero and using the cash to establish a second income stream in the same month with a new position.

The hypothetical trade

  1. Buy shares @ $74.
  2. STO $74 calls (ATM) @$2.50.
  3. Buyback $74C’s @0.50.
  4. Rolldown to $70 strike C’s @$2.
  5. Price rockets way up to $78.
  6. Buyback $70C’s @ $8.20

The questions

- Now what I want to know is that if I am correct here in knowing that the intrinsic value of the last option (#6) is $8, and T.V is at $0.20(for the $8.20 option), then am I to also take the MCU share gain as $8?(from $70 to $78)

- It can’t surely be from $75 up to $78 can it, as time value would be too large? (or am I wrong?)

- Is my calculation correct for a -$4.20 total options loss, and +$8 for price gain to = +$3.80 profit?

Let’s take off our shoes and socks and do the math

Based on this example I see the confusion commonly experienced by covered call writers. There are 2 sets of calculations that should be viewed individually but frequently are combined and that will cloud the situation. The 1st calculation relates to whether to pull the trigger on the MCU strategy or not. The 2nd is the overall profit (loss) results. Let’s address the MCU 1st:

1- We base our decision whether to completely close our short option and long stock positions based on the current market value of our shares which was rolled down to $70. We do not base it on some value in the past ($74). The time value component to accomplish this is $0.20 because the shares can be sold for $78 and gain $8 in share value at this point in time. If we can generate more than $20/$7000 or .28% (a fraction of 1%) by re-investing that newly-acquired cash, we should pull the trigger on the MCU strategy.

2- Final results: we don’t know yet because the cash generated from instituting the MCU strategy hasn’t been re-invested so the final chapter hasn’t been written. However, to date you have an options debit of:

$2.50 + ($2.00 – $0.50) – $8.20 = (-) 4.20 (sum of all options credits and debits)

You have a share credit of $78 – $74 = + $4 (bought at $74 and sold @ $78)

Total loss to date = (-) $0.20

This tabulates to a fraction of 1% as shown in the figure below:

covered call writing exit strategies

Mid-contract unwind exit strategy


Now, it’s up to us to write the final chapter that month and re-invest the $7800/contract to turn that small loss into a gain. We turn to our watch list of eligible stocks, find an appropriate price per share and check options chains. The information is fed into the Ellman Calculator as we make our final decisions.

This is a great example of how being active can, in many cases, allow us to manage our positions to mitigate losses, turn losses into gains and enhance gains.

April seminar in Arizona (Phoenix area):

Tuesday, April 8th


Family Investment Library

New product package available in our Blue Collar store combining 2 of our best-selling books and saving $5:

http://www.thebluecollarinvestor.com/package-family-investment-library/


Market tone:

This week marked another reaffirming an improving economy but with geo-political and global economic concerns:

  • 4th quarter GDP was revised upward to 2.6% from 2.4% according to the Commerce Department
  • Initial jobless claims for the week ending 3-22-14 came in @ 311,000, less that the projected 325,000
  • Consumer spending reached its highest level in 3 years, up 2.2%, according to the Commerce Department
  • Sales of new single-family homes dropped by 3.3% in February and 1.1% lower than 1 year ago. This decline was due to rising mortgage rates and severe weather conditions
  • Savings rate for February was up 4.3%
  • According to the Conference Board, Consumer Confidence rose by 4 points to 82.3, higher then the expected 78.6. This is the highest level in the past 6 years
  • New orders for durable goods rose by 2.2% in February after declining the previous 2 months
  • Personal consumer spending rose by 0.3% in February more than the 0.2% anticipated
  • Personal income rose by 0.3% in February

For the week, the S&P 500 declined by 0.5%, for a year-to-date return of 1%, including dividends.

Summary:

IBD: Market in correction

BCI: This site continues to be bullish on the economy. It’s difficult to ignore years of improving economic reports. However, because global political and economic concerns we remain slightly bearish in our current holdings, favoring in-the-money strikes 3-to-2.

My best to all,

Alan (alan@thebluecollarinvestor.com)

www.thebluecollarinvestor.com


Ask Alan – Is It Too Expensive To Buy Back The Options When The Stock Price Increases?

$
0
0

Alan answers a question posed by Al from Melbourne, Florida. who asks:

“One of my first option choices was to sell 5 positions on HTZ with a strike price of $20. When I opened the position, HTZ was trading at $21.06 per share, and I received the premium of $1.40 per share when I sold to open on March 22nd. The stock has been moving upward since I purchased it and today was trading at $23.49. Now, the strike price is pretty deep in-the-money so I tried to input the data into the (Elman) Calculator to see if it makes sense to unwind the position, but I’m not sure that I’m interpreting it correctly. It appears that it would cost me $350 per share to buy back the option. What is your read on this?”

If you want more “Ask Alan” videos, you can view the archive.


More Video:


To enter your questions to “Ask Alan”, fill out the form on the contact page. Be sure to begin your message with “ASK ALAN”.


Ask Alan – Are We Losing Money When the Stock Price Goes Up?

$
0
0

Alan answers a question shared by Greg, who asks:

“On the Intro tab of the Ellman Calculator I believe there is a mistake. In Part B of selling OTM calls the stock closes at $61.50 and you add the $1.50 to the premium when calculating results. Shouldn’t that $1.50 be deducted from the profit since you are losing $1.50 because you have to sell the stock for $60? What am I missing here? Thanks.”

If you want more “Ask Alan” videos, you can view the archive.


More Video:


To enter your questions to “Ask Alan”, fill out the form on the contact page. Be sure to begin your message with “ASK ALAN”.

Combining Technical Analysis And Market Assessment To Determine Strike Selection

$
0
0

Mastering stock and strike price selection are key components in successful covered call writing. There is no one factor that will dictate our choices but rather a mosaic of bits of information which will lead us to the best selections. In this article, I will discuss two of those critical components: technical analysis of the underlying security and overall market assessment. Let’s start with viewing the chart of an elite performer on our Premium Watch List dated 4-4-14 (Continental Res, Inc. or CLR):


covered call writing and technical analysis

CLR- bullish chart pattern

At this point, we have an elite performer both fundamentally and technically and one would be leaning to selling one of the bullish out-of-the-money strikes. However, let’s have a look at the chart of the S&P 500 and VIX (CBOE Volatility Index or investor fear gauge) to evaluate our overall market assessment:


Covered call writing and the CBOE Volatility Index

VIX rising this past week

S&P 500 versus the VIX

 Note that in the past one month, the market volatility has increased significantly (15%) while the value of the S&P 500 has declined by 2.5%.  For many investors, this red flag guides us from bullish out-of-the-money strikes to the more conservative in-the-money strikes giving us a bit of a cushion when it comes to capital preservation. Next, let’s view the options chain for CLR at the time I produced the above screenshots:


strike price selection in volatile markets

CLR- options chain

With CLR trading @ $128.02, we will evaluate the in-the-money $125 strike and out-of-the-money $130 and $135 strikes feeding the stats into the multiple tab of the Ellman Calculator:


Strike price selection and covered call writing

Calculations for CLR

The out-of-the-money $130 and $135 strikes create the potential for returns of 4.9% and 7.6%, respectively. Neither offers downside protection of the time value. The in-the-money $125 strike generates a nice 3.3%, 5-week return (time value only) with downside protection of 2.4%.  This means that we are guaranteed a 3.3%, 5-week return as long as our shares do not depreciate in value by more than 2.4% by expiration. I call this downside protection (very different from breakeven) an insurance policy that is paid for by the option buyer, not by us.

Conclusion

Many factors are considered when selecting underlying securities and strike prices for covered call writing. Taking the most bullish positions (out-of-the-money strikes) are most appropriate when both chart technicals are bullish and confirming as well as overall market assessment also bullish. If either component is compromised, selling in-the-money strikes will afford us downside protection and provide a cushion for capital preservation.


Next live seminar:

Saturday, June 14th

8:30 – 11 AM

Costa Mesa, California (Orange County)

BCI members who will be attending may want to get to the venue a bit early. I’m told by the chapter President that they are expecting a much larger attendance than normal based on the number of recent inquiries from non-chapter members.

Click for more information and registration


Market tone:

As some “talking heads” continue to forecast doom and gloom the economic reports continue to retort: “But what about this?”

  • Total construction spending increased by 0.2% in April, below the 0.6% expected, and advanced for the 3rd straight month
  • Construction spending is 8.6% above stats from a year ago
  • The US trade deficit widened to $47.2 billion in April from $44.2 billion in March, the largest margin since July, 2012. The silver lining was the healthy import statistics
  • According to the Federal Reserve Board, the Beige Book report noted expansion in all 12 of its regional districts
  • Initial jobless claims for the week ending May 31st came in @ 312,000, below the 318,000 expected by analysts
  • According to the Labor department, 217,000 jobs were added in May, meaning that the US Labor Market has now returned to pre-recession levels
  • Unemployment remained @ 6.3% and the number of unemployed remained @ 9.8 million
  • Compared to a year ago, unemployment is down 1.2% and the number of unemployed decreased by 1.9 million
  • The ISM Manufacturing Index increased in May to 55.4 from 54.9 in April. Economists had projected a figure of 55.2
  • All but one of the manufacturing industries showed growth in May
  • The ISM Non-Manufacturing Index (measures service-sector trends) rose to 56.3 in April from 55.2 in March, the 4th straight monthly rise. The index is now at its highest point since August, 2013. Any reading above 50 signals expansion
  • Both business activity and new orders indexes reached their highest levels since 2011, as 17 of the 18 nonmanufacturing industries showed growth (only the mining industry contracted)
  • According to the Labor Department, nonfarm business productivity fell by 3.2% in the 1st quarter, worse than the decline of 1.0% expected. Severe weather conditions in January and February was largely responsible. Compared to a year ago, productivity is actually up 1%
  • According to the Commerce Department new orders for manufactured goods rose by 0.7% in April, the 3rd straight monthly gain and well ahead of the 0.2% predicted by economists. March’s stats was revised higher by 1.5%

For the week, the S&P 500 rose by 1.3%, for a year-to-date return of 6.4%, including dividends.

Summary:

IBD: Confirmed uptrend

BCI: Moderately bullish favoring out-of-the-money strikes 2-to-1.

Wishing our members much success,

Alan (alan@thebluecollarinvestor.com)

www.thebluecollarinvestor.com

Ellman Calculator: Enhancements Made In The 2014 Version

$
0
0

Options calculations are an integral part of our BCI methodology both in guiding us in making the best investment decisions and also in determining our trading success. To assist in achieving these goals I developed the Ellman Calculator six years ago and with the benefit of your suggestions my team and I have been enhancing the tools and information this spreadsheet provides. In this article, I will describe the additions we are proud to announce for the 2014 additions of both the Basic and Elite versions of the Ellman Calculators.

Enhancements to both the Basic and Elite versions of the Ellman Calculators

Multiple tab

We have added a breakeven column, based on the feedback of many of our members. This is quite different from the downside protection column which applies only to in-the-money strikes where the intrinsic value of the premium protects the time value of the premium. In the screenshot below, I have highlighted the breakeven column which is the price paid for the shares minus the entire option premium.

covered call writing and option calculations

Ellman Calculator: multiple tab showing breakeven column


In the top row, we paid $128.02 for the stock and sold the $125 call for $7.10 resulting in a breakeven of $120.92. Once the share price drops below $120 92 can have an unrealized loss.

What now tab for rolling options

This tab is used for calculating our returns when rolling options on or near expiration Friday. We have added a statistic for the percentage of downside protection we generate when rolling out or rolling out and up to an in-the-money strike as shown in the screenshot below:

Ellman Calculator when rolling options

What now tab showing % of downside protection

The past versions of the Ellman Calculator showed only a dollar amount per contract of downside protection. For example, if a stock was trading @ $32 and we rolled out to the $30 call, our downside protection showed as $200. With this enhancement, it will also show as 6.25% ($2/$32), similar to the downside protection column used in the multiple tab. In the above screenshot, the downside protection for rolling out (next month’s same strike) came to 33.30% and rolling out and up to the next month’s higher in-the-money strike came to 2.80%.  This is the percentage amount the intrinsic value of the premium protects the time value of the premium.

Enhancements only to the Elite version of the Ellman Calculator 

Unwind now tab

This tab is used to determine if the mid-contract unwind exit strategy (see pages 264 – 271 of the Complete Encyclopedia for Covered Call Writing) makes sense. This is when the stock price rises well above the original strike sold and the time value of the option approaches zero. The goal is to close the entire position at little or no cost and use the cash to generate a second income stream in the same month with the same cash (see pages 264 – 271 of the Complete Encyclopedia For Covered Call Writing). The enhancement we created is the time value cost to close and the percentage of the cost basis we are paying to close this position. We can then determine if the cash freed up by closing can generate a significantly higher return than the cost to close. Below is a screenshot of this enhanced tab in action:

covered call writing exit strategy calculations

Unwind now tab of the Ellman Calculator 2014


In this case, the cost to close is $20 or a fraction of 1% (0.29%). If the cash generated from the sale of the stock can produce > 0.29%, then it makes sense to unleash the mid-contract unwind exit strategy.

Schedule D entry codes

Previous versions of the Elite Calculator showed dollar amounts of gain (loss). We have now added two columns on the right side of the page that will calculate % gain (loss) and annualized % gain (loss) as demonstrated in the graphic below:


Ellman Calculator- Schedule D % returns

The Elite Calculator- Schedule D enhancements

The original versions, the calculator showed only a gain of $190 per contract. Now we can visualize this return as a 2.73% return which annualizes to 31.14% based on the number of days the trade was on.

Where can I get these calculators?

The Basic Ellman Calculator is free to all and can be downloaded to your computer directly from the “free resources” link located on the top black bar of these web pages. Just put in your email address and you’re in. The Elite version of the Ellman Calculator is available for purchase in the Blue Collar store or free to premium members in the “resources/downloads” section of the premium site. Just scroll down to “Elite Calculator”


Join our mailing list:

There are many perks involved in joining the BCI mailing list. Find out about upcoming seminars and free webinars as well as new products and discounts for both premium and general members. If you are receiving the weekly newsletter, you are already part of our growing list and thank you for that. If not, the best way to opt in, is to sign up for the free newsletter as shown below on the blog page:

Blue Collar Investor free newsletter

Join our BCI mailing list

Market tone:

Despite the Commerce Department’s 3rd and lowest estimate for the 1st quarter GDP, where the economy shrank to 2.9% on an annualized basis, the financial markets appeared resilient and positive. The reason has to do with the unusual circumstances of severe weather, loss of temporary benefits for the long-term unemployed and unusual buildups of business inventories in the 2nd half of 2013:

  • The Conference Board’s Index of Consumer Confidence (a gauge of consumers’ attitudes about the present economic situation as well as their expectations regarding future conditions. Consumer confidence tends to have a strong correlation with consumer spending patterns) rose to 85.2 in June, the highest level since 2008 and ahead of the 83.5 reading expected
  • According to the Commerce Department, sales of new homes rose by an impressive 18.6% in May, a 6-year high. This represents an annualized figure of 504,000, well above the 400,000 predicted by experts
  • The median price for new homes rose to $282,000 in May from $269,700 in April
  • On a year-to-year basis, new home sales were up 16.9% and the median price of those homes rose by 6.9%
  • The number of new homes on the market in May declined to 4.5 months of supply, down from 5.3 months in April
  • According to the national Association of Realtors, existing home sales rose by 4.9% in May, the best showing in 3 years. This represents an annualized rate of 4.89 million units compared to the 4.73 million analysts were projecting
  • Supply of existing homes fell to 5.6 months in May from 5.7 months in April
  • In May, the median price of existing homes rose to $213,400 from $201,500 in April

For the week, the S&P 500 was unchanged for a year-to-date return of 7.2%


Summary:

IBD: Confirmed uptrend

BCI: Moderately bullish favoring out-of-the-money strikes 2-to-1

Wishing you the best in investing,

Alan (alan@thebluecollarinvestor.com)

www.thebluecollarinvestor.com

Calculating 2-Month Returns When Rolling Out And Up

$
0
0

Options calculations will give us an accurate assessment of our covered call writing profits. It’s more meaningful to use percentages rather than dollar amounts when executing these calculations. For example, a $1000.00 profit on a $10,000 investment (10%) is much more significant than a $1000 return on a $100,000 investment (1%). That’s why percentages forms the foundation for both versions of the Ellman Calculator (Basic and Elite).

A few months ago, one of our members, Jonathan, shared me with one of his successful covered call writing trades and inquired about percentage returns month-to-month. In this article, I will breakdown that trade and use the Ellman Calculator to demonstrate the second leg of the trade where Jon rolled out and up:

The trade in 100 share format

  • 2/10/14: Buy 100 x AGN @ $120.36
  • 2/10/14: Sell 1 x Feb. $120 call @ $2.52
  • 2/21/14: Share value = $125.59
  • 2/21/14: Buy back Feb $120 call @ $6.20
  • 2/21/14: Roll out and up to the March $125 call @ $4.10
  • 3/21/14: Option expires in-the-money and shares are sold for $125


The calculations

You will note that the trade was established mid-February contract. Here is the final returns from the first 12 days of the trade as shown in the “multiple tab” of the Ellman calculator:

covered call writing calculations

AGN returns: first 12 days


Jon achieved a very nice short-term return (1.8% in 12 days) and then decided to roll out (next month) and up (higher strike price). For this computation we use the “what now tab” of the Ellman Calculator and first fill in the blue cells on the left:

covered call writing calculations

Calculating rolling out and up returns

The option was bought back @ $6.20 and the next month’s higher strike was sold for $4.10. The key point here is that our cost basis is now $120, not $120.36 or $125.59. The reason is that we are deciding whether to roll the option or allow assignment we must compare “apples-to-apples” If we permit assignment we will receive $120/share as per our initial option obligation. If we roll the option, our cost basis must be the same so we can decide which approach is in our best interest. Once the blue cells on the left side of this tab our filled in as shown above, the white cells on the right side become populated with results:

calculating covered call writing returns using the Ellman Calculator

AGN: final rolling calculations

Once the shares were sold as a result of option exercise on 3/21/14, a 2.42%, 1-month return was realized and Jon had $12,500/contract in cash to use the following week for the April contracts.


2-month final returns

In reality this is a 6-week return because the trade was initiated mid-contract in February:

1.8% + 2.42% = 4.22% = 36.6% annualized


Summary

Although calculations can be challenging for many of us, using percentages and the Ellman Calculator will make our covered call writing decisions more meaningful and help elevate our returns to the highest possible levels. For a detailed discussion of covered call writing calculations see pages 99 – 152 in the Complete Encyclopedia for Covered Call Writing. Also, for a free version of the Basic Ellman Calculator see the “free resources” link on the black bar at the top of this page…just enter your email address and download this tool to your computer.


Next live seminar:

Saturday July 19th

Arlington, Virginia

Washington DC Chapter of  the American Association of Individual Investors

9 AM – 10AM Dr. Eric Wish will speak (outstanding presenter)

10 AM – 12PM I will present a covered call writing seminar

http://www.aaii.com/localchapters/pdfs/Washington%20DC%20Metro%20140719.pdf

Market tone:

This was an extremely light week for economic reports but The Federal Reserve officials did make some significant comments. For the first time they set an end date of October to end the bond-buying program as long as the US economy continues its expansion. The program has been reduced from $85 billion to $35 billion at a pace of $10 billion per month and plans to decrease by the final $15 billion in October. The Fed funds rate should remain near zero for the foreseeable future even past the termination of the bond-buying program. The latter depends on inflation remaining below the 2% target rate. This week’s reports:

  • Consumer credit [a report of the dollar value of consumer debt, including categories such as credit card use and store charge accounts (known as revolving debt) as well as longer-term loans for autos, education, recreation vehicles, etc. (known as non-revolving debt). The level of consumer credit is considered a barometer of consumers' financial health and an indicator of potential spending patterns] rose by $19.6 billion in May mainly due to strong auto sales
  • April stats for consumer borrowing was adjusted higher to a gain of $26.1 billion, the largest increase since December, 2010
  • Initial jobless claims for the week ending July 5th came in @ 304,000, near expectations

For the week, the S&P 500 declined by 0.8% for a year-to-date return of 7% including dividends.


Summary:

IBD: Uptrend under pressure

BCI: Moderately bullish, expecting another favorable earnings season and favoring out-of-the-money strikes 3-to-1

Wishing you the best in investing,

Alan (alan@thebluecollarinvestor.com)

www.thebluecollarinvestor.com

Writing Covered Calls On Broad Market Exchange-Traded Funds

$
0
0

The initial main step for covered call writers is to select the best underlying security. This choice will vary from investor to investor based on goals and risk tolerance. Some of our members prefer exchange-traded funds (ETFs), a strategy I use in my mother’s portfolio. ETFs offer the advantages of instant diversification, less volatility (in most cases) and less management time required. The main disadvantage is the lower returns generated by these securities because of the lower implied volatility and therefore time value of the option premiums.

To keep the process even simpler, some covered call writers will write calls against a broad market index ETF like SPY. This will give the writer exposure to the entire S&P 500 which historically appreciates 7-10% per year. As an example, I created a screenshot of the options chain for SPY with about 3 1/2 weeks remaining in the July, 2014 contracts:

covered call writing with ETFs

SPY options chain


With SPY trading @ $195.88, we will view the out–of-the-money $196, $197, $198 and $199 strikes.

We feed this information into the “multiple” tab of the Ellman Calculator to see if the results meet our goals:

covered call writing and the Ellman Calculator

SPY- calculating covered call returns


With upside potential (share price moves up to strike price by expiration) the 3 1/2 week returns range from 0.9% ($196 strike) to 1.8% ($199 strike). The more bullish we are on the overall market, the deeper out-of-the-money strikes should be favored.

Now another, and perhaps even better, approach to this type of investing is to use the best-performing Select Sector SPDRs. These securities are unique ETFs that divide the S&P 500 into nine sector index funds.  They have the diversity of a mutual fund, the focus of a sector fund, and the tradability of a stock. Together, the nine Select Sector SPDRs represent the S&P 500 as a whole. However, each Select Sector SPDR can also be bought individually, providing you with exposure to a particular sector or industry group.

These securities all have options and can be used with our covered call strategy. Each week the BCI Team will do a 3-month technical analysis of the linear price chart of each sector and compare it to the performance of the S&P 500 itself. The top 3 funds outperforming the market benchmark will be listed and considered to be among the best candidates for covered call writing in the near-term. We will also show a chart of all sector components. Below is a recent screenshot showing the 3 best-performing Select Sector SPDRs as of 6-18-14:


covered call writing with ETFs

SelectSector SPDRs-top performers


Summary:

In the cases of both SPY and the Select Sector SPDRs, we have the advantages of exchange-traded funds as long as we are targeting the lower (but still significant) returns they generate compared to individual stocks. By using the SPDRs, we are limiting our exposure to the best-performers at any given point in time and can rotate in and out of them much like institutional traders do.

 ***For a free copy of the Basic Ellman Calculator use the “Free resources” link on the black bar at the top of this page.


Website issues

Several members of my tech team have been working to upgrade the servers that support both the general and premium sites to accomodate the increased traffic (thank you for that!) we have been experiencing recently. This process should be completed sometime next week. Some of you have noticed slowdowns or downtime as a result of the site enhancement and I want to express my apologies for that but feel it will ultimately create a stellar site experience for all our members. Thank you for your support and understanding. I will keep you updated especially when we will need to shut down the site for a few hours to finalize the upgrade.


Market tone

This was just another slow summer week with not much happening except an escalating mid-east crisis, a catastrophic downed Malaysian airliner, Janet Yellen’s testimony before the Senate Banking Committee and a mixed, but mostly favorable, series of economic reports:

  • The Federal Reserve Beige Book described an economy with “moderate to modest expansion”
  • The Conference Board’s index of leading economic indicators rose by 0.3% in June, the 10th increase in 11 months
  • Initil jobless claims for the week ending July 12th came in @ 302,000 below the 310,000 expected
  • Retail sales increased by 0.2% in June but still left sales near its lowest levels since January but up 4.3% year-to-year
  • Industrial production was up by 0.2% in June, the 4th increase in the past 5 months
  • Construction of new homes fell by 9.3% in June, the weakest showing since September, 2013
  • Permits for single-family homes increased for the 2nd month in a row and up 7.5% from a year ago
  • Business inventories rose by 0.5% in May
  • The Producer Price Index rose by 0.4% in June as the Fed watches for any hint of inflation reaching its 2% target to consider raising short-term interest rates

For the week, the S&P 500 rose by 0.5% for a year-to-date return of 8%, including dividends.

Summary:

IBD: Uptrend under pressure

BCI: Moderately bullish but cutting my bullish trading stance slightly selling out-of-the-moeny striles 2-to-1. My concerns are relating to the 2 major global conflicts and mixed signals from the housing industry.

My best to all,

Alan (alan@thebluecollarinvestor.com)

www.thebluecollarinvestor.com

Viewing all 108 articles
Browse latest View live