Quantcast
Channel: Ellman Calculator – The Blue Collar Investor
Viewing all 108 articles
Browse latest View live

Ask Alan #101 – Managing a Risky Trade

$
0
0

Alan answers a question shared by Ty, who asks:

“I flat out gamble on one trade in my portfolio, and this is my gamble stock: (1) On 6/30/14 I bought GWPH at $103.90 and sold the 8/16 $105 call @ $9.00. (2) The earnings report (ER) is 8/6/14. (3) As of 7/1/14 GWPH ran up to $111.46. (4) At the writing of this email it’s at $107.10 where it seems to have leveled off. (5) $10.90 is the cost to buy back the option. I have read your books and watched the DVDs about stocks shooting to the moon and buying back the options. Problem is my brain freezes. It seems like the premium is lost every time no matter what the situation is. When I do my version of the long math I should hold my position and let the option run its course. It seems if I buy back I will lose $900 premium. Is this correct? Also, I am not sure I am filling out the “what now” calculator properly. Can you fill it out correctly and send it back to me so I see how it’s done the right way. Thank you for everything. This has truly changed my life.”

If you want more “Ask Alan” videos, you can view the archive.


More Video:


To enter your questions to “Ask Alan”, fill out the form on the contact page. Be sure to begin your message with “ASK ALAN”.


Calculating Future Returns Using Delta

$
0
0

Understanding option calculations is an integral part of the BCI methodology. Using the Ellman Calculators (Basic and Elite versions) will facilitate the process but knowing the “how” and “why” of these numbers will make us all better investors.

This article was inspired by Peter, one of our members. He was concerned about the potential drop in share price of a covered call trade he was in and wanted to calculate future returns based on the current delta of the option. Before I set up the trade for you let’s define delta:

The amount an option value will change for every $1 change in share price. Delta values run from 0 to 1 and the greater the chance that the strike will end up in-the-money, the higher the delta (the closer it is to 1).

Here is Peter’s trade from several months ago so I will use our generic BCI as the stock and 1 contract for simpler math:

  • Buy 100 x BCI @ $62.46
  • Sell 1 x $55 call @ $9.75
  • Current share price is $60.06
  • Current “ask” for the $55 call is $9.85
  • Delta for the $55 call = 0.68 (moves $0.68 for every $1 move in share price)


Peter’s initial returns using the multiple tab of  The Ellman Calculator:

Covered call writing calculations

Calculating initial returns using the Ellman Calculator

We see an impressive 1-month return of 4.2% (time value only) and protection of that profit of an also impressive 11.9%

 ***A free copy of the Basic Ellman Calculator and its user guide can be downloaded from the “free resources” link on the top black bar of this page.

Calculating future returns using delta:

Peter was wondering what his position would be if share price dropped by $2 in the next week. Let’s calculate using delta with the understanding that there are other factors that will influence option premium like time value erosion (theta) and changes in implied volatility of the underlying security (vega). So all other factors remaining about the same, the delta of 0.68 will cause option value to decrease by $1.36 (2 x $0.68) when share value drops to $58.06. That means the cost to close (“ask”) will be $8.49 ($9.85 – $1.36). Okay everybody, take off your shoes and socks and let’s calculate this hypothetical circumstance:

  • Share loss = $4.40 ($62.46 – $58.06)
  • Option credit = $1.26 ($9.75 – 8.49)
  • Net debit = $3.14 per share or $314 per contract ($4.40 – $1.26)

The takeaway here is that if Peter closes his entire position given this hypothetical scenario, he would lose $314 per contract. So where would he be if he didn’t close?


To close or not to close:

Unless some egregious news has come out about the company in question, Peter is still in great shape in this trade. The deep in-the-money strike sold ($55) generated an 11.9% downside protection of the time value component of the original option sale (4.2%). This means that Peter was guaranteed a 4.2% 1-month return as long as share value did not decline below $55. Even if the $2 drop in share value does occur, there is still another $3.06 in downside protection protecting that profit. At this point, the trade is still a classic “take no action” situation again as long as there was no unusual news reported by the company.


When do we start losing money:

Well we always have our exit strategy arsenal in place to avoid or mitigate losses but our breakeven is always share price – total option premium. In this case:

$62.46 – $9.75 = $52.71

With the stock currently trading at $60.06, even a share drop of $2 will leave us a galaxy away from the breakeven. Sometimes the best action to take is no action at all.


Next live seminar: Coral Springs, Florida: Just added:

I will be in SE Florida for 11 days in early September attending to family real estate business and was invited to speak at a local options club which meets 15 minutes from where I’m staying. As many of you know, I’ve never met a microphone that I didn’t want to speak into when it comes to covered call writing, sooooo….

South Florida Options Trading Forum

Thursday September 11th
6-9PM

http://www.meetup.com/options-fl/events/198999922/


Ask Alan videos:

Just a reminder that new Ask Alan videos will be posted on the blog the 2nd Wednesday of each month with some additional videos available on the general site and the entire set available on the premium site. These changes are currently being set up by my outstanding team members.


Market tone:

It appears that the recent market volatility is related on geo-political events occurring in the Middle East and increasing tension between the US and Russia. It certainly cannot be blamed on this past week’s economic reports which continue to be positive:

  • According to the Labor Department, the annualized rate of non-farm productivity (a measure of the growth of labor efficiency in producing the economy’s goods and services) rose by 2.5%. Year-over-year, productivity was up 1.2%
  • Initial jobless claims for the week ending August 2nd came in at 289,000, less than the 302,000 expected
  • According to the Institute of Supply Management, the ISM Non-Manufacturing Index rose to 58.7 in July, showing continued expansion and at the highest level since 2005
  • Consumer credit (excluding mortgages) increased by $17.3 billion in June according to the Federal Reserve. This is a report of the dollar value of consumer debt, including categories such as credit card use and store charge accounts (known as revolving debt) as well as longer-term loans for autos, education, recreation vehicles, etc. (known as non-revolving debt). The level of consumer credit is considered a barometer of consumers’ financial health and an indicator of potential spending patterns. This represents an increase of  6.5% year-over-year
  • According to the Commerce Department, new orders for manufactured goods rose by 1.1%, well above the 0.6% anticipated. Factory orders were up 2.5% year-over-year
  • The US trade deficit decreased by 7% in June to $41.5 billion, narrower than expected and a result of stronger growth in the 2nd quarter

For the week, the S&P 500 was up 0.3%, for a year-to-date return of 6%, including dividends.

Summary:

IBD: Market in correction

GMI: 1/6: Sell signal since market close August 4, 2014

BCI: Moderately bullish but continuing to favor in-the-money strikes while the market digests the events alluded to above.

Wishing you the best in investing,

Alan (alan@thebluecollarinvestor.com)

www.thebluecollarinvestor.com

Using Beta To Capture Higher Premium Returns

$
0
0

When using covered call writing and put-selling strategies it is important to set goals for initial returns in order to select the most appropriate underlying security and option. My goal for initial returns is 2% – 4% per month and a bit higher in a bull market environment. Recently, several of our members have contacted me inquiring about a way to scan eligible stocks for premiums that may meet these goals. This article will address this issue using our Premium Stock Report but other resources may be used as well.One of the columns inherent in our member reports is beta. This is a measure of the volatility of a security as compared to the S&P 500. A stock with a beta of “1″ has the same statistical or historical volatility as the S&P 500 and would be expected to perform similarly. Stocks with betas > 1 have higher-than-market volatility and those with betas < 1 have lower-than-market volatility Beta is therefore based on actual historical statistics.

Implied volatility, on the other hand, is a market forecast of the underlying’s volatility as implied by the current option’s pricing. Implied volatility impacts option premium more directly than does beta. However, it makes sense that those securities with higher betas will generally also have higher implied volatilities, admittedly with some exceptions. With that in mind, we will set up a screen for higher option returns by screening for eligible stocks (passed our fundamental, technical and common sense screens) that have betas > 1.50. We also want to be sure that the stocks have no earnings reports due out before contract expiration and the associated options have adequate open interest.

Below is a screenshot of the information gleaned from the Premium Stock report dated 2-13-15 (members wait for the new report to come out) and the option chains:


using beta when selling cash-secured puts and covered call writing

High-beta stocks

You will note that five of the nine candidates are in the “Chips” industry segment so we must be cautious not to over weigh our portfolio in one particular segment. If more candidates are needed, we can always drop our beta requirement a bit, perhaps to > 1.30. Next, we will enter the options data into the multiple tab of the Ellman Calculator (free copy by clicking the “Free Resources” link on the top black bar of this page and then scrolling down to sign in). For the purposes of this article, we will view out-of-the-money strikes only but this can be expanded to other strikes as well:


Calculating covered call writing and put-selling returns

Calculations for stocks with high betas

The column highlighted in yellow, ROO, represents the actual time value initial returns which do meet our 2%c – 4% goals. The column featured in brown, upside potential, shows additional profit that may be generated if share price moves up from current market value to the strike. For example, should SWKS move up from its current price of $82.17 to the $85 strike, the total 1-month return would be 5.6% (2.2% initial profit + 3.4% from share appreciation to the strike).

Summary

One approach to screening eligible stocks for higher option returns is to look at beta statistics. The process includes setting initial goals, establishing a minimum beta required, checking options chains and then running the calculations. All this should take less than 20 minutes for those with a quality watch list.


FREE Beginners Corner tutorial for puts

Just added to our website: An 8-part video series based on my latest book. Each of the 8 videos are between 5 -10 minutes long. Click on the link shown below and enter your email address to enter the classroom:


selling puts

Link to Beginners Corner for puts


Next live seminars: 

February 28th and March 1st

The International Stock Trader’s Expo: New York City: Marriott Marquis Hotel


Saturday February 28th 12:50 to 1:35 PM (new time)

Sunday March 1st 1:30 – 2:30 PM

Both seminars are free to attend.


Market tone
This week’s reports were mixed but still supporting an expanding economy:
  • The minutes from the January 27 -28 FOMC meeting reflects continued discussion as to when to raise interest rates, a positive sign for the resilience of our economy
  • The Conference Board’s leading Economic Index (LEI) rose by 0.2% in January below the 0.3% expected, but still suggesting a bullish short-term outlook in 2015
  • The Producer price Index (PPI) dropped by 0.8% in January (economists projected a drop of 0.4%) mainly due to declining energy prices
  • Housing starts fell to 1,065,000 in December, a drop of 2% but year-over-year growth was up 18.7%. Severe weather conditions were a major factor
  • Building permits were down by 0.7% in December but up 8.1% year-over-year
  • Industrial production rose by 0.2% in January lower than the 0.3% projected by experts
  • Initial jobless claims for the week ending February 14th came in at 283,000, less than the 292,000 expected
For the week, the S&P 500 rose by 0.6%.

Summary

IBD: Confirmed uptrend

GMI: 6/6- Buy signal since market close of January 23, 2015

BCI: Cautiously bullish using an equal number of in-the-money and out-of-the-money strikes. Global issues are still looming over our markets as possible short-term negative factors

Wishing you the best in investing,

Alan (alan@thebluecollarinvestor.com)

www.thebluecollarinvestor.com


Capital Gains (Losses) For Covered Call Writing In Non-Sheltered Accounts

$
0
0

Whether we sell covered calls or cash-secured puts strong consideration should be given to trading in sheltered accounts whenever possible. Most, if not all, of our trades will be short-term in nature (less than one year) and therefore will be taxed at the ordinary income tax rate (up to 35%) which is much higher than the short-term capital gains tax rate (15%) if we trade in non-sheltered accounts.

What is a Capital Gain?

This is an increase in the value of as capital asset, such as a stock or an option, which gives it a higher worth than the purchase price. It must be claimed on income taxes in non-sheltered accounts.

Rules for Covered Call Writers:

Premiums received for writing a covered call are not included as income at the time of receipt, but are held in suspense until the writer’s obligation to deliver the underlying stock expires or until the writer either sells the stock as a result of the call assignment or by closing the option position (buy-to-close). With that in mind, here are three possible scenarios that may occur after the sale of the option:

1- An expired option (we sold the call, we didn’t close the position by buying back the option and the holder did not exercise the option) results in a short-term capital gain. For example, we sell a BCI April 90 call for $4.50 in March. The proceeds are $450. Since the cost is $0, the short-term capital gain is $450. The acquisition date will be LATER than the sales date and the word “Expired” should be written in column e, the cost basis column.

2- If we buy back the same option in the above example to close the position (usually to execute an exit strategy), the difference between the sale profit and the buyback cost will represent a capital gain or a capital loss. As in example 1, above, the acquisition date will be LATER than the sales date.

Capital gain example: We close our position by buying back the option for $250. The capital gain is $200 ($450 – $250).

Capital loss example: We close our position by buying back the option for $550. The capital loss is $100 ($550 – $450).

3- If the option is exercised, the option transaction becomes part of the stock transaction. The option premium is added to the strike price received, less commissions. If the stock has been held for less than one year, the entire transaction will be treated as short-term. If the stock had been held for one year or more, the entire transaction will be treated as long-term as the option holding period is ignored.

***The Schedule D of the Elite Calculator is designed to assist your tax advisor with these long and short-term capital gains (losses) issues:

covered call writing and capital gains
Acquisition date later than sale date


capital gains or loses from covered call writing
Capital gain (Loss) calculations


The specific information referenced above can be found in IRS Publication 550 entitled Investment Income and Expenses, pages 57 – 58.

I avoid these tax issues by trading covered call stock options predominantly in tax-sheltered accounts.

In an upcoming article, I will discuss capital gains and losses related to selling cash-secured puts.

***Contact your tax advisor before making any investment tax-related investment decisions.


Premium members: All Beginners Corner Videos on Premium Site for your convenience:


covered call writing and put-selling tutorials
Complete Beginners Corner video series now on Premium Site

Scroll down on the left side of the premium site below the stock and ETF reports.


Next live seminars: Central Florida this week:


Market tone

With a strengthening dollar and lower oil prices, there are renewed concerns of the Fed raising interest rates. This was a light week for economic reports:

  • Business inventories were flat in January, below analyst expectations
  • Ratio of business inventories to sales increased to 1.35 from 1.33 in December, highlighting the number of month’s it would take to empty shelves based on current sales. This is a critical indicator for the short-term direction of production activity
  • Retail sales fell 0.6% in February, below expectations. The auto industry was the main culprit as well as severe weather conditions
  • Retail sales were actually up 1.7% from a year ago
  • Experts consider the still lower gas prices a positive for the outlook for retail sales
  • The Producer Price Index (PPI- a leading indicator for inflation) dropped by 0.5% in February, the 4th consecutive monthly decline
  • The PPI is down 0.6% year-over-year
For the week, the S&P 500 declined by 0.9% for a year to date return of 0.2%, including dividends.

Summary

IBD: Uptrend under pressure

GMI: 3/6- Buy signal since market close of January 23, 2015

BCI: Cautiously bullish using an equal number of in-the-money and out-of-the-money strikes. A strong dollar and low gas prices are making investors nervous that the Fed may raise interest rates sooner rather than later.

Wishing you the best in investing,

Alan (alan@thebluecollarinvestor.com)


Rolling Out Decisions: Evaluating a Real Life Trade

$
0
0

Rolling options is an important exit strategy choice when selling covered call and put options. Options can be rolled up and down in the same contract month or a future contract month. For the most part, we roll down in the same contract month and roll out or out-and-up in the next contract month.  I recently wrote an article evaluating a trade executed by one of our members where an option was rolled up in the same contract month, an approach I rarely subscribe to. In this article we will evaluate another real-life trade by one of our members (we have a great group!) where an option was rolled out. The two-month results were positive but could they have been better?


The initial trade with VRX: Month 1:

  • 5/26/2015: Buy 100 VRX at $234.60
  • 5/26/2015: Sell 1 x June $240.00 call at $4.50
  • 6/17/15: Early on expiration Friday the stock was still trading near $234.60

Let’s feed this preliminary information into the multiple tab of the Ellman Calculator:

calculating covered call writing returns

VRX- Initial Calculations


We see a respectable 1.9% initial return with the possibility of an additional 2.3% from share appreciation. Because share price remained stagnant, the actual one-month return was 1.9% or 23% annualized. Very nice so far.


The second trade with VRX: Month 2:

The option was rolled out to the next month $240 strike. This involved closing the June $240.00 contract (BTC) and opening the July $240.00 contract (STO). The option credit for these trades netted $0.20. Then, mid-contract, the option was rolled down to the $235.00 strike. Here are the trades in month 2:

  • 6/17/2015: Rollout to the July $240.00 strike for a net credit of $20.00 for the contract
  • 7/8/2015: BTC (buy-to-close) the July $240.00 call at $2.35
  • 7/9/2015: STO (sell-to-open) the July $235.00 call at $4.50
  • 7/17/2015: VRX was trading at $240.00 level and shares were sold at $235.00


Calculating 2-month returns

The shares were purchased at $234.60 and sold for $235.00, a net credit of $40.00 for the 100 shares (less small trading commissions). There were option credits of $450.00 + $20.00 (includes rolling option debit) + $450.00 = $920.00. There was an option debit of $235.00. The net option credit was $685.00. The total position credit was $685.00 + $40.00 = $725.00 which calculates to a 2-month return of 3.1% on a cost basis of $23,460.00. This annualizes to 18.5%. On the surface this looks pretty good especially when we compare it to other investment choices we have these days.


Could the trade have been improved?

As Blue Collar Investors, we are always looking for ways to elevate our returns, even good ones, to higher levels. A 3.1% 2-month return appears reasonable on the surface but of that total, 1.9% was generated in month 1. The remaining 1% was generated in month 2 so therein lies the weakness of this 2-month trade. It seems that the option from month 1 was rolled when there was no need to do so. The share price was much less than the strike ($240.00) and so allowing the option to expire worthless was the prudent thing to do (take no action). That would eliminate any time value spent to close the near-month option plus eliminate one commission. Since the shares would not be sold, the next month option could be sold on Monday. Let’s make the reasonable assumption that the time value remaining on the near month option was $0.10 and so the next month $240.00 strike sold for $0.30, leaving a net credit of $0.20. Even if the option wasn’t rolled the initial return of the next month option ($0.30 is our educated assumption) only generated 0.12% initial profit, far too little.


How to improve this 2-month trade

  • First, don’t roll the option
  • Sell a lower strike if VRX was still maintained as an underlying security, probably the $235.00 strike which was used late in the contract
  • Using the $235.00 strike would have generated a significantly higher time value return especially if it was used early in the contract. It is reasonable to assume the return would be greater than the $4.50 originally generated in the near month trade (which had a higher strike of $240.00).
  • If the calculations for VRX did not meet our goals, sell the stock and use a different security


Discussion

Exit strategies like rolling options are absolutely critical to maximizing covered call returns. There are times when these strategies should and should not be used. Setting goals for initial monthly returns is one way we are guided to proper decisions. For example, if a trader sets a goals range for monthly returns of 2-4% as I do, a rolling return of 0.12% would never be given consideration. That said, the trade was an overall success and I commend our member for the way it was managed. Now let’s take that 18% annualized return and bump it up even higher.


Next live appearances

1- St. Louis, Missouri

September 15, 2015

6:30 PM – 9 PM

Link to register


2- All Stars of Option Trading

September 16, 2015

Discussion panel

New York Stock Exchange

4:20 PM – 5:15 PM


Market tone

Financial markets took a breather from recent volatility, and global stocks generally rebounded after a run of daily losses ended Monday. US data releases were mixed. This week’s economic reports:

  • US GDP grew at an annualized pace of 2.3% in the second quarter, below the median economist forecast of 2.6%. First-quarter GDP was revised up to 0.6% growth from the 0.2% contraction reported previously. Growth was the result of an increase consumer spending and strengthening labor and housing markets
  • The Fed’s two-day July meeting ended Wednesday with no policy action and only minor changes in the post-meeting statement
  • The employment cost index rose a seasonally adjusted 0.2% in the second quarter, the smallest quarterly gain since recordkeeping began in 1982. Sluggish wage growth could cause the Fed to wait longer before raising interest rates
  • US home prices continued to rise but pending home sales fell and the home ownership rate sank to a 48-year low
  • The S&P/Case-Shiller Home Price Index rose 4.4% in the 12 months ended in May, up from 4.3% in April
  • Pending home sales declined 1.8% in June after five straight monthly increases
  • The home ownership rate dropped to 63.5% in the second quarter, the lowest since 1967
  • US nondefense capital goods excluding aircraft, a key proxy for business spending plans, increased 0.9% in June after falling 0.4% in May
  • Overall durable goods orders rose 3.4%, driven by an 8.9% jump in orders for transportation equipment
  • The University of Michigan consumer sentiment index fell to 93.1 for the final July reading down from 96.1 in June and below the median economist forecast of 94.0
  • The Conference Board’s index of consumer confidence dropped to 90.9 in July from a downwardly revised 99.8 in June. The current reading is the lowest since September 2014, and the monthly decline was the steepest since August 2011
  • Initial US jobless claims rose 12,000 to 267,000 for the week ended July 25th
  • Continuing claims climbed 46,000 to 2.26 million for the week ended July 18th

For the week, the S&P 500 rose by 1.16% for a year-to-date return of 2.18%.

Summary

IBD: Uptrend under pressure

GMI: 5/6- Buy signal

BCI: Cautiously bullish using an equal number of in-the-money and out-of-the-money strikes.The Fed watch continues with a probable rate hike of 25 basis points in September or December. When it occurs, it may temporarily spook the market.

Wishing you the best in investing,

Alan (alan@thebluecollarinvestor.com)

Using Volatility to Predict Future Stock Prices

$
0
0

Volatility is a key consideration for both stock selection and option-selling decisions. Despite its relevance to our covered call writing and put-selling selections, volatility does have its limitations and we must fully understand how we can best take advantage of the information gleaned from volatility statistics.


Types of volatility

Historical volatility: The annualized standard deviation of actual past stock prices. Even if two stocks start and end at the same price over a period of one year, they can have very different historical volatilities as reflected in the chart below:


volatility and option-selling

Historical Volatility of Two Stocks


Note that both stocks begin and end the year priced at $100.00 per share but the “blue” stock was much more volatile over that time frame. This demonstrates that historical volatility is not based on a directional trend but rather on the amount that the price oscillates.

Our Premium Member Stock Reports give historical volatility information as it relates to the S&P 500 in our “running list” as shown in the screenshot below:

volatility and covered call writingBeta stats from our Premium Stock Reports

Beta stats from our Premium Stock Reports

Implied volatility: This is the market’s forecast of the stock’s annualized standard deviation volatility based on price changes in the option. This is more important to short-term option-sellers than is historical volatility because it is forward-looking. Implied volatility will impact the time value component of an option premium only and has no effect on intrinsic value. Implied volatility is expressed as a percentage of the share price, indicating a one standard deviation move over a twelve-month time frame. Let me explain. Let’s say a stock is trading at $50.00 and has an implied volatility (again based on option pricing) of 20%. This means we can anticipate a price fluctuation 0f $10.00 (20% of $50.00) in either direction or a price range from $40.00 to $60.00. The fact that this is an annualized statistic based on one standard deviation means that the range is anticipated over a twelve month time frame and is accurate 68% of the time. This can be better visualized using a normal distribution curve:


implied volatility and future stock price

Normal Distribution Curve for One Standard Deviation


Note the following:

  • Share price is expected to fall between $40.00 and $60.00 68% of the time over a one year time frame
  • 16% of the time, share price will be lower than $40.00
  • 16% of the time, share price will be greater than $60.00


How is implied volatility calculated?

An option pricing model like Black Scholes is used and the following information is required:

  • Stock price
  • Strike price
  • Expiration date
  • Risk-free interest rate
  • Dividends (if applicable)
  • Option price


Converting implied volatility stats to shorter term options

Since we rarely sell one-year expiration options we must add one more component to our equation in predicting future price movement based on implied volatility and that is to multiply by the square root of the number of days to expiration divided by 365:

[$50.00 x 20% x SR (Days to Expiration/365)]

Limitations of implied volatility when determining future stock prices

  • Does not predict direction
  • Depends on market assessment (option prices) which may or may not be accurate
  • Based on theoretical calculations from an option-pricing model
  • Annualized stats must be converted to the time frame of the option contract

Implied volatility stats are listed on pages 7 and 8 of our Premium Member ETF Reports.


Discussion

Understanding and utilizing volatility statistics are absolutely critical when trading stocks and stock options (exchange-traded funds as well). For short-term option-selling, implied volatility is more relevant than historical volatility. As helpful and useful as these data stats are, we must understand and factor in the limitations they possess so we can best utilize them in our day-to-day investment decisions.


BCI referenced in option article by Jason Levy

http://www.dailysludge.com/selling-puts/


Next live appearance

American Association of Individual Investors National Conference

Bally’s Hotel

Las Vegas, Nevada

November 7th – November 9th

Sunday November 8th @ 8:30 AM – 9:45 AM (Alan’s seminar)

Exhibit Hall # 313

***Event is sold out


Market tone

Global stocks moved higher due to strong US economic data, strong corporate earnings, China’s rate cut and the expectation of further stimulus from the European Central Bank. Alphabet (Google), Microsoft, Amazon, McDonald’s and General Motors beat earnings estimates, although IBM, Morgan Stanley and disappointed. This week’s reports:

  • US home resales increased 4.7% in September to an annual rate of 5.5 million units, the second-highest monthly sales pace since February 2007
  • The Federal Housing Finance Agency House Price Index (FHFA HPI) rose a seasonally adjusted 0.3% in August, up 5.5% from a year earlier on the strengthening job market and shrinking inventories
  • The National Association of Home Builders housing market index rose to a 10-year high of 64 in October
  • New home construction starts rose 6.5% in September to an annualized rate of 1.21 million, above consensus and the second-highest level in eight years
  • The Bloomberg Consumer Comfort Index fell from 44.5 in September to 42 in October
  • Initial jobless claims increased 3,000 to 259,000 for the week ending October 17th, remaining near a 42-year low
  •  Continuing claims rose 6,000 to 2.17 million for the week ending October 10th

For the week, the S&P 500 rose by 2.07% for a year to date return of 0.79%.

Summary

IBD: Confirmed uptrend

GMI: 6/6- Buy signal since market close of October 19, 2015

BCI: Cautiously bullish using an equal number of in-the-money and out-of-the-money strikes. There are many encouraging signals including the S&P 500 moving above its 50-d and 200-d moving averages and moving into positive territory year-to-date. However, recent volatility and weakness with retail and energy stocks are keeping me fro0m taking more aggressive positions. I remain fully invested.

Wishing you the best in investing,

Alan (alan@thebluecollarinvestor.com)


LEAPS and Covered Call Writing: A Review and a Hypothetical Example/ Contest Application

$
0
0

A covered call writing-like strategy involves buying deep in-the-money LEAPS options and then selling short-term slightly out-of-the-money call options. Leaps become a stock surrogate. The term Leaps stands for Long Term Equity AnticiPation Security. They have expiration dates up to 2 1/2 years out.


Defining spreads

Technically, covered call writing with LEAPS is known as a diagonal spread because both options have the following characteristics:

  • Same stock
  • Different strikes
  • Different expiration dates

This differs from a calendar spread which has the following characteristics:

  • Same stock
  • Same strike
  • Different expiration dates


Hypothetical example

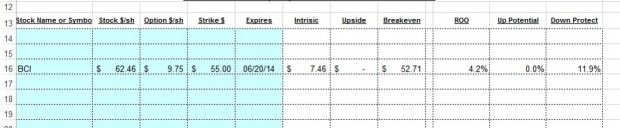
  • BCI trading at $60.00 in August, 2015
  • Buy 1 x January, 2017 $40.00 LEAPS for $22.00
  • Sell 1 x September $65.00 call for 2.00

Advantages of LEAPS

  • Risking less capital ($22.00 per share as opposed to $60.00 per share)
  • Higher rate of return (ROI) as gains are magnified due to leverage

Disadvantages of LEAPS

  • Requires more active management because we don’t own stocks to deliver
  • Smaller pool of stocks to select from (fewer stocks have LEAPS compared to Monthlys)
  • Wider bid-ask spreads than stocks
  • Leverage works both ways with losses also magnified


Outcomes

Best case scenario

Ideally, we would like share price to rise $0.01 below the $65.00 strike and having the short call expire worthless. Here we would have generated $2.00 in option premium plus $4.99 in unrealized share appreciation. We can then write another short call.

Worst case scenario

Our maximum loss, if share price moves to $0.00 is $22.00 – $2.00 = $20.00 per share. This, of course, assumes no position management, an unrealistic assumption for Blue Collar Investors.

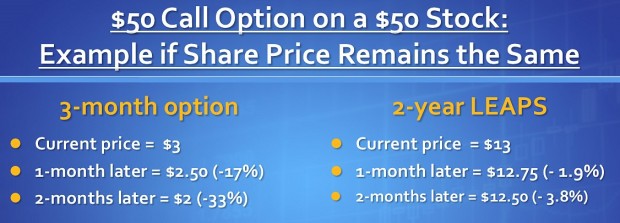
Stock price remains the same

The short call expires worthless and we write the next month’s (October) slightly out-of-the-money call

Stock price moves up slightly

We can close both legs of the trade for a small gain. We may also opt to take no action in hopes of the option expiring worthless if share price remains below the strike price.

Stock price moves down slightly

We can close both legs of the trade for a small loss. We may also decide to take no action if the decline is minimal and write another call the next month.

Stock price moves above the $65.00 strike

This is where our management skills come into play. Let’s say the share price moves up from $60.00 to $68.00. As expiration of the short call approaches, the premium will be slightly above $3.00, say $3.10 ($3.00 of intrinsic value + $0.10 of time value). The $40.00 LEAPS is $28.00 in-the-money plus has a larger time value component, let’s say $1.50 for an estimated premium of $29.50. Now, if we exercise the LEAPS and sell the stock for $65.00 from short-call exercise, our net gain in $25.00. However, if we close the spread by buying back the short call for $3.10 and sell the LEAPS for $29.50, we have a net credit of $26.40, an additional profit of $140.00 per contract.

We do have one other course of action here. We can roll the option to the next month $60.00 call or roll out-and-up to a higher strike. The calculations will dictate whether this latter strategy meets our goals.


How to structure a LEAPS/Covered call trade

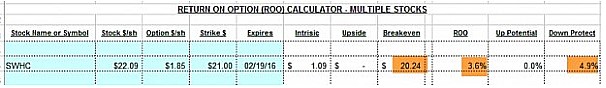
These trades should be set up such that, if both legs are closed, it is closed at a profit:

Difference between the two strikes + premium generated from the short call must be greater than the cost of the LEAPS option.
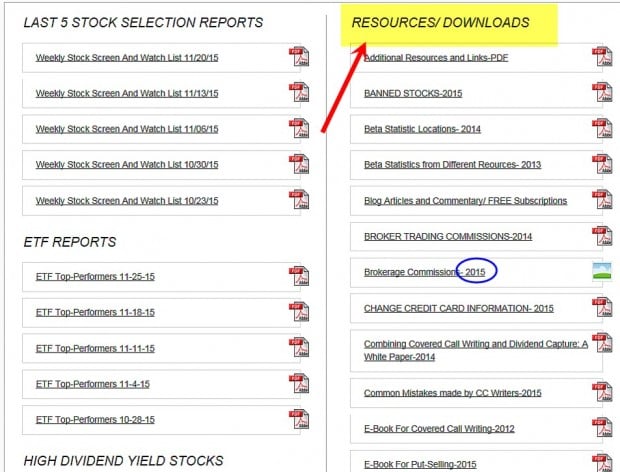
 

Brokerage concerns

We will need special approval to use this strategy, probably a higher level of approval than for traditional covered call writing. We will be asked about our goals, risk tolerance, knowledge of options trading as well as portfolio balances and net worth. These requirements are broker specific so we must ask our broker for this information.


Self-directed IRA accounts

As a general rule of thumb, traditional covered call writing is permitted in self-directed IRAs but LEAPS covered call writing is not.


Discussion

Using LEAPS as a stock surrogate with covered call writing has its advantages and disadvantages. Each investor must measure his own risk tolerance to make a determination as to whether this strategy has a place in the family portfolio.


Blue Collar Scholar Competition: Great prizes and a worthy charity

Blue Collar Scholar Competition- 2015

Blue Collar Scholar Competition- 2015

We’re trying something new thanks to Jay’s idea. Here are the parameters we are using: Two contests running simultaneously with six prizes:

Contest #1: What will be the value of the S&P 500 by year’s end?

Contest #2: In five sentences or less, give your reason(s) for your response (subjective, voted on by the BCI team)

Prizes in each category (total of 6).

Donation to the USO (United Services Organization) of $5000.00 worth of books.

Click on this link for our contest video and entry form.


Next live appearance

American Association of Individual Investors National Conference

Bally’s Hotel

Las Vegas, Nevada

November 7th – November 9th

Sunday November 8th @ 8:30 AM – 9:45 AM (Alan’s seminar)

Exhibit Hall # 313

***Event is sold out


Market tone

US stocks rose overall while global markets were mixed. US economic reports were also mixed but in line with expectations. Data from Japan and the eurozone were stronger than anticipated. This week’s reports:


US economic growth slowed to a 1.5% annual rate in the third quarter mainly caused by a large inventory impediment that deducted 1.44 percentage points off the GDP

The US Federal Reserve maintained low interest rates this week, but would consider a rate increase at its December meeting

New US single-family home sales fell in September to close to a one-year low after a few monthly gains

Sales fell 11.5% to a seasonally adjusted annual rate of 468,000 homes

The S&P/Case-Shiller home price index rose 4.7% in the 12 months ending in August, up slightly from July

US consumer spending rose just 0.1% in September after increasing 0.3% and 0.4% in July and August. September’s increase was the smallest since March

The price index for personal consumption expenditures, the Fed’s favored inflation gauge, fell 0.1% in September and rose just 0.2% from a year ago

The Conference Board’s Consumer Confidence Index fell from 102.6 in September to 97.6 in October

US durable goods orders fell a seasonally adjusted 1.2% in September after a revised 3% drop in August

Initial jobless claims increased 1,000 to 260,000 for the week ending October 24th

Continuing claims fell 37,000 to 2.14 million for the week ending October 17th, the lowest in 15 years

For the week, the S&P 500 rose by 0.20% for a year to date return of 0.99%.

Summary

IBD: Confirmed uptrend

GMI: 6/6- Buy signal since market close of October 19, 2015

BCI: Cautiously bullish using an equal number of in-the-money and out-of-the-money strikes.

Wishing you the best in investing,

Alan (alan@thebluecollarinvestor.com)

A Review of Volatility and its Impact on Option-Selling

$
0
0

When we write covered calls or cash-secured puts, we are selling volatility. The time value component of a short-term option premium reflects the amount of time until expiration plus the volatility of the underlying security. Since most of us are comparing options with similar expirations, the volatility of the stock or exchange-traded fund represents the distinguishing factor in our option sales. In this article, we will review all aspects of volatility and bring this information into our world of option-selling.


What is volatility?

Volatility represents the price movement of the underlying security with no predilection to direction. It is an annualized statistic quantified as one standard deviation price change. This tells us that the statistic is projected to be accurate 68% of the time. This means that if a $60.00 stock has a volatility of 25%, it is expected to fall in the price range of $45.00 to $75.00 over one year 68% of the time. Two stocks that start and end with the same price over a one-year time frame can have very different volatilities as shown in the chart below:

volatility and covered call writing

Comparing volatility of two stocks


Although both securities started and ended the year at $100.00, the “blue” stock has much greater volatility and will generate higher option premiums at the expense of being a riskier underlying security. Each investor must determine the amount of volatility appropriate for their personal risk tolerance. For me, I have a goal of 2 -4% for a near-the-money one month expiration. In bull markets, I’ll go a bit higher. The question we should ask ourselves is “how much volatility should I sell?”


Types of volatility

Historical volatility: The actual price fluctuation as observed over a period of time, usually one year.

Expected volatility: This is a prediction of future price movement in either direction and is totally subjective. This is the least significant of the three types of volatility.

Implied volatility: This is a prediction of the underlying security’s future price movement based on the option’s price in the marketplace. For short-term option-sellers, this is the most significant of the three types of volatility. An event like an upcoming earnings report can render the implied volatility much higher than the security’s historical volatility.


Impact of volatility on our option premiums

An increase in volatility will increase the value of both call and put options and a decrease in volatility will cause a decline in both call and put premiums.


The role of Vega

Vega is the amount an option price will change given a 1% change in implied volatility. Let’s say that company BCI has an option value of $4.00 and a Vega of 0.06. The current value of one contract is $400.00. If the implied volatility increases by 1%, the option value for the contract will be $406.00. If the implied volatility decreases by 2%, the value of the contract will become $388.00, all other factors remaining the same.


Impact of Vega and the “moneyness” of options (for every 1% change in volatility)

In-the-money options: Have the least amount of time value and therefore the smallest dollar and percentage changes.

At-the-money options: Have the greatest time value and the largest dollar changes.

Out-of-the-money options: These are all time value and therefore the highest percentage changes.


Discussion on incorporating volatility into our option-selling strategies

As covered call writers and sellers of cash-secured puts, we are selling volatility. For our short-term positions, implied volatility is the most most significant of the three types of volatility because it reflects the current market assessment of future price movement of our underlying security. A great starting point for incorporating volatility into our trading decisions is to set return goals based on personal risk tolerance. A conservative starting point may be 2-4% per month for near-the-money strikes. Extremely high or low implied volatilities will not meet this standard. Goals can be tweaked based on your objectives and risk tolerance. Once size does not fit all!


Blue Collar Scholar Competition: Great prizes and a worthy charity

We’re trying something new thanks to Jay’s idea. Here are the parameters we are using: Two contests running simultaneously with six prizes:

Contest #1: What will be the value of the S&P 500 by year’s end?

Contest #2: In five sentences or less, give your reason(s) for your response (subjective, voted on by the BCI team)

Prizes in each category (total of 6).

Donation to the USO (United Services Organization) of $5000.00 worth of books.

Click on this link for our contest video and entry form.


Contest results to date

Outlook

% bearish: 8%

% neutral: 41%

% bullish: 51%


Sample Commentary from Arturo S:

Because in a 100 day chart there was a “W” formation and it hit that amount 3 times already. Knowing it’s about the end of the year, people will be cashing in on this bullish scenario.

Thanks for the great response we’ve had to this event. Keep those entry forms coming. We allow two per email address and the deadline is November 30th.


I’ve been remiss in not saying this in a while

A special thanks from me the entire BCI team to our premium subscribers for making these reports and tools a success beyond our wildest dreams.


Next live appearance

American Association of Individual Investors National Conference

Bally’s Hotel

Las Vegas, Nevada

November 7th – November 9th

Sunday November 8th @ 8:30 AM – 9:45 AM (Alan’s seminar in Bronze Room)

Exhibit Hall # 313

***Event is sold out


Market tone

Major global stock markets were neutral this week on mixed economic data. Growth in Europe offset weakness in China, while US data was generally bullish especially Friday’s jobs report. Asian stocks rose, with the Shanghai Composite Index gaining 20% since its August low, signifying a bull market. This week’s reports:

  • US nonfarm payrolls grew by 271,000 in October, exceeding the median consensus of 180,000
  • The unemployment rate fell to 5.0%, the lowest since April 2008
  • Average hourly earnings rose by 0.4% from September and were 2.5% higher than a year earlier. It was the highest year-over-year wage increase since 2008
  • The U-6 rate, which measures underemployment  fell to 9.8%, a seven-year low. After the stellar payrolls report and comments by US Federal Reserve Chair Janet Yellen on Wednesday, a December  rate hike is now more probable
  • The US trade gap narrowed to a seven-month low in September as US oil imports fell to their lowest level in more than 11 years. The deficit narrowed to $40.8 billion in September from $48 billion in August
  • US light vehicle sales increased 13.6% in October from a year earlier. For a second consecutive month, the annualized sales pace exceeded 18 million, the best two-month stretch in 15 years. The auto market is on pace for its strongest annual results ever

  • The Institute for Supply Management’s non-manufacturing index rose to 59.1 in October from 56.9 in September. The US service sector has expanded for 69 straight months
  • The ISM manufacturing index fell from 50.2 in September to 50.1 in October, the weakest reading since May 2013
  • US labor productivity unexpectedly rose at a 1.6% annualized rate in the third quarter
  • Initial jobless claims increased 16,000 to 276,000 for the week ending October 31st
  • Continuing claims increased 17,000 to 2.16 million for the week ending October 24th

For the week, the S&P 500 rose by 0.95% for a year to date return of 1.96%.

Summary

IBD: Confirmed uptrend

GMI: 6/6- Buy signal since market close of October 19, 2015

BCI: Cautiously bullish using an equal number of in-the-money and out-of-the-money strikes. I will remain cautious but fully invested until after the December Fed meeting.

Wishing you the best in investing,

Alan (alan@thebluecollarinvestor.com)


Ask Alan 116 “Is Covered Call Writing a Zero Sum Game?”

$
0
0

Alan answers a question posed by Todd, who asks:

“Is it true that options is a zero sum game? If so, if covered call writers are more likely to make money in the long run, who are buying these options and taking predominantly losing positions?”
———
It’s the 2nd Wednesday of the month. Time for another original episode of Ask Alan. AA#116, “Is Covered Call Writing a Zero Sum Game?”

If you want more “Ask Alan” videos, you can! Become a premium member today, and tune in to the educational power of the complete library!


More Video:


To enter your questions to “Ask Alan”, fill out the form on the contact page. Be sure to begin your message with “ASK ALAN”.

Mechanics of LEAPS

$
0
0

LEAPS are long-term options that have expiration dates between nine months and two and a half years out. The term is an acronym for Long Term Equity AnticiPation Securities. Once the expiration date is less than nine months away, LEAPS convert to conventional options. Some covered call writers will buy LEAPS in lieu of stocks and then sell call options on the same underlying security in what is known as a calendar spread. When both the strike prices and expiration dates of the long and short option positions are different, the strategy is known as a diagonal spread. When LEAPS are purchased, the mechanics of these securities are different from those of the shorter-term options we are more familiar with.  This article will highlight these disparities.


Why buy LEAPS?

LEAPS are cheaper than stocks so we are leveraging these securities to generate higher returns on our investments (ROI). If we buy a deep in-the-money LEAPS with a delta between 0.90 and 1.00, the option will behave much like its corresponding stock but at a much lower cost. Also, the time value erosion of LEAPS is much less than that of shorter-term options as seen in the screenshot below:

theta and options

Time value decay of LEAPS


The time value erosion of LEAPS starts out slowly and linear. As it becomes a short-term option (approaches expiration) the pattern becomes logarithmic and falls off as cliff (right side of screenshot).


Disadvantages of LEAPS related to covered call writing

  • Stock owners capture dividends, LEAPS holders do not
  • Requires a higher level of trading approval than stock ownership when using covered call writing
  • We are buying time and must overcome the time value paid for the option, slippage due to wide bid-ask spreads and time value erosion (theta) to make a profit or even break even
  • Available on a limited number of stocks
  • Bid-ask spreads are wide due to the nature of market-makers trying to price volatility so far into the future


LEAPS slower time decay when stock price remains the same


mechanics of options

Time decay of LEAPS vs Short-Term Options


If share price rises early, short-term options benefit (same example as above)

Option expirations and theta

Time value erosion of options when share price rises


Short-term options benefit more from a rise in share value than do LEAPS. However, as the short-term options reach expiration, they will be trading near parity ($3.00 of intrinsic value if the stock price is $53.00 for a $50.00 strike) while the LEAPS will still have significant time value component to it.


Discussion

Buying LEAPS is the same as buying time. The leverage involved can result in much higher percentage returns but we must overcome the time value cost to buy the security, wide bid-ask spreads as well as time value erosion to generate a profit. Understanding the mechanics of LEAPS is essential before implementing this product into our investment portfolios.


Blue Collar Scholar Competition: Great prizes and a worthy charity

Here are the parameters we are using: Two contests running simultaneously with six prizes:

Contest #1: What will be the value of the S&P 500 by year’s end?

Contest #2: In five sentences or less, give your reason(s) for your response (subjective, voted on by the BCI team)

Prizes in each category (total of 6).

Donation to the USO (United Services Organization) of $5000.00 worth of books.

Click on this link for our contest video and entry form.


Contest results to date

Outlook

% bearish: 15.0%

% neutral: 15.8%

% bullish: 69.2%


Sample Commentary from Dagmar:

Weekly chart of S&P is in an uptrend. The monthly chart is reversing up and resistance is the previous all time high. Usually, from October to December into Christmas market sees an uptrend.

Thanks for the great response we’ve had to this event. Keep those entry forms coming. We allow two per email address and the deadline is November 30th.


Next live appearance

I’m taking December off for family time (articles and videos will continue but no travel). Check out the link below for upcoming events thus far booked for 2016:

Events calendar

I am in discussion with other investment groups throughout the country and expect  my 2016 calendar to be fully booked in the very near future. Thanks to all of our members for making this possible.


Market tone

Global equity markets declined as China reported more weakness while expectations rose for a Fed rate hike in December. Germany’s slowing growth was related to China’s weakness and increased the likelihood of more European Central Bank stimulus in December. These economic concerns were reflected in a moderately increasing VIX, not a friend of covered call writers but also not a reason to panic. This week’s reports:

  • US retail sales increased by 0.1% in October, below expectations
  • Auto sales fell 0.5% after rising 1.4% in September, differing with industry reports of strong October auto sales of more than 18 million units annualized
  • Core retail sales (excluding autos, gasoline, building materials and food services) rose 0.2% after an upwardly revised 0.1% gain in September
  • US import prices fell 0.5% in October, a larger decline than expected as the strong US dollar and weak global demand continued to push down the prices of imported goods. For the 12 months through October, prices dropped 10.5%
  • The University of Michigan preliminary consumer sentiment index rose to 93.1 in November from 90 in October. The improvement was a result of a stabilizing labor market and low fuel prices
  • Initial jobless claims were unchanged at 276,000 for the week ending November 7th
  • Continuing claims increased 5,000 to 2.17 million for the week ending October 31st

For the week, the S&P 500 fell by 3.63% for a year to date return of (-)1.74%.

Summary

IBD: Uptrend under pressure

GMI: 4/6- Buy signal since market close of October 19, 2015

BCI: Cautiously bullish using an equal number of in-the-money and out-of-the-money strikes. Decisions on positions for the December contracts will be made based on market action this upcoming week but expect to be in at least  50% in-the-money strikes until the Fed makes its position on interest rates known.

Wishing you the best in investing,

Alan (alan@thebluecollarinvestor.com)

Rolling Down with CALM: Turning Losses into Gains

$
0
0

Exit strategies for both covered call writing and selling cash-secured puts is one of the three required skills for maximizing investment returns. Whether we are mitigating losses, turning losses into gains or enhancing winning positions to even higher levels, we must have the capability to take advantage of all position management opportunities. In this week’s article I will highlight a rolling down strategy I used in my personal portfolio for the November contracts for Cal-Maine Foods, Inc. (CALM).


Trade overview

exit strategies for covered call writing


1: 10/19/2015

  • CALM trading at $60.02
  • Sell-to-open the $60.00 at $3.75

2: 10/26/2015 and 10/27/2015

  • Ex-dividend date captures a premium of $0.98 per share (10/26)
  • Share price decline is partially due to ex-date
  • Buy-to-close the $60.00 call at $0.80 adhering to our 20% guideline
  • Initial goal is to “hit a double”

3: 11/10/2015

  • Share price does not accelerate adequately to “hit a double” so we move to plan B…rolling down
  • Roll down to the $57.50 strike generating a premium of $1.40


Price chart for the November $60.00 call


exit strategies for covered call writing

CALM: November, 2015 $60.00 Call Option

Note the following:

1: $60.00 call sold at $3.75

2: $60.00 closed at $0.80

3: Option price does not accelerate enough to justify “hitting a double”


Price chart for the November $57.50 call


rolling down and covered call writing

Rolling Down to the $57.50 November Call Option


Rolling down ten days prior to contract expiration allowed us to generate a higher premium than the cost-to-close ($1.40 versus $0.80) and afford us some downside protection. This is an excellent example of how we should always be prepared with a secondary exit strategy plan (rolling down) if our initial plan (“hitting a double”) cannot be implemented.


Final trade results (trade commissions omitted…use an online discount broker)

Unrealized share loss: $60.02 – $56.77 = (-)3.25

Option credits: $3.75 + $1.40 = $5.15

Option debit: (-) $0.80

Dividend capture: $0.98

Net position after contract expiration: + $2.08 per share or $208.00 per contract


Discussion

After entering our option-selling trades we must immediately enter into “position management mode” Most of the time exit strategy execution will not be necessary but when it is, it is imperative we take advantage of these opportunities. In the case of CALM for the November contracts, we used covered call writing, our 20% guideline and then the rolling down strategy to turn a share loss of $3.25 per share into a net position gain of $2.08 per share. Mastering all three of the required skills (stock selection, option selection and position management) is what sets Blue Collar Investors apart from all the other option-sellers.


Blue Collar Scholar Competition: Great prizes and a worthy charity

HURRY: CONTEST DEADLINE IS NOVEMBER 30th

Click on this link for our contest video and entry form.


Contest results to date

Outlook

% bearish: 12.8%

% neutral: 22.3%

% bullish: 64.9%


Sample Commentary from Vincent:

“The Fed will not raise interest rates in December.   Retail sales will be flat or rise slightly.  The dollar will rise in value relative to the Euro and other major global currencies”.


Thanks for the great response we’ve had to this event. Keep those entry forms coming. We allow two per email address and the deadline is November 30th.


Next live appearance

Saturday January 23rd, 2016: Kansas City, Missouri

Details to follow

Events calendar

I am in discussion with other investment groups throughout the country and expect  my 2016 calendar to be fully booked in the very near future. Thanks to all of our members for making this possible.


Market tone

Global financial markets rose surprisingly unaffected by the tragic events in Paris. Investors seem to be accepting signs of a Fed interest rate hike in December. US equity markets advanced strongly and the Chicago Board Options Exchange Volatility Index (VIX) fell below 16 from 20 last week. This week’s reports:

  • US Federal Reserve officials focused on a possible December interest rate hike at their October policy meeting, according to minutes released Wednesday. Financial markets reacted favorably thus far
  • The US Consumer Price Index (CPI) rose by 0.2% in October. Core prices, excluding food and energy, also gained 0.2%. Core prices were up 1.9% from a year ago
  • Real average hourly earnings climbed 0.2% in October and were up 2.4% from October, 2014.
  • US new-home construction declined by 11% in October
  • However, permits for new construction, a leading indicator, rose 4.1% to a 1.15 million annual rate
  • Permits for single-family homes increased 2.4% to their highest level since 2007
  • Homebuilder confidence fell slightly in November after reaching a 10-year high in October
  • US industrial production fell by 0.2% in October, according to the Fed, and capacity utilization fell slightly
  • Factory output increased for the first time in three months, with a 0.4% increase
  • Continuing claims fell 2,000 to 2.18 million for the week ending November 7th

For the week, the S&P 500 rose by 3.27% for a year to date return of 1.47%.

Summary

IBD: Confirmed uptrend

GMI: 5/6- Buy signal since market close of October 19, 2015

BCI: Cautiously bullish using an equal number of in-the-money and out-of-the-money strikes. I remain fully invested using 50% in-the-money strikes until the Fed makes its position on interest rates known and evaluating the ensuing market reaction. I believe that most institutional investors have factored in a 25 basis point rate hike with moderating guidance from the December Fed meeting.

Wishing you the best in investing,

Alan (alan@thebluecollarinvestor.com)

Moneyness of Options: Why Call and Put Premiums for the Same Stock, Strike and Expiration can be so Different/ CONTEST DEADLINE IS NOVEMBER 30th

$
0
0

Option trading basics teaches us that the concept of put-call parity means that for every call option price, the corresponding put option (same stock, strike and expiration) will have an implied value. For example, if Company BCI is trading at $50.00 per share, if the $50 call option generated $1.50, the put option would also be expected to generate $1.50. The reason for this is that if there was a movement away from this parity there would be an arbitrage opportunity where one option could be bought and the other sold for a risk-free profit.  Now this concept applies to European style options. Since, in reality, we are dealing with American style options, dividends and interest rates need to be factored in. As an example, if the $50.00 stock had an ex-dividend date prior to expiration and the dividend amount was $1.00, the call option would be worth less and the put option more because share price will drop by the dividend amount on the ex-date. This will impact calls negatively and puts positively.

The “moneyness” of options

Another factor that impacts the value of the option premiums is the “moneyness” of the option or the relationship between the strike price and the market value of the stock. In the example below, Taser Intl Inc. (TASR) was trading at $30.90 on 7/24/2015. That would make the $31.00 strike very close to at-the-money. But what about the $30.00 strike? Well that strike is in-the-money for calls and out-of-the-money for puts. From this perspective we would expect the call option to be more expensive because of the intrinsic value component. Let’s view an options chain to make this concept come alive:

Let's first look at the $31.00 strike price (brown row) which is very close to at-the-money. The blue arrows highlight the fact that the option-pricing is the same thereby confirming the following put-call parity rule:

Buy stock + buy put = Buy call

If there was a disparity between the put and call premiums at this strike it would set up an arbitrage opportunity for market makers to take advantage of and generate a risk-free profit...not fair to us.

Next, let's have a look at the $30.00 strike price in the yellow-highlighted row. This strike is considered in-the-money for calls but out-of-the-money for puts so we would anticipate a higher premium for the call option because of the intrinsic value component of the option premium. This is confirmed with a bid price of $2.40 for the call and $1.45 for the put as shown with the green arrows. Next, let's calculate the time value for the call option:

Time value = Total premium - intrinsic value

Time value = $2.40 - $0.90 = $1.50

Now the two time values are in sync, the call at $1.50 and the put at $1.45.

Discussion

Put-call parity is an important concept in option pricing as it prevents unfair arbitrage opportunities. If these opportunities did present themselves, it would benefit market-makers, not us. There are factors that would create a discrepancy between the same strike prices for the same stock and expiration. These include interest rate factors, dividends and the moneyness of options. Understanding these concepts will elevate us the elite status as covered call writers and put-sellers.


Blue Collar Scholar Competition: Great prizes and a worthy charity

HURRY: CONTEST DEADLINE IS NOVEMBER 30th

Click on this link for our contest video and entry form.


Contest leaders as of Friday's market close (S&P 500 reading at the end of the year)

Vincent L

Joe S

Michael P


Sample Commentary from Chris:

“With the economy getting back on its feet, I think the markets will see more consumer confidence. With the potential rate hike everyone seems to be talking about though, it might suffer a minor setback. I think it will rise but a conservative rise”.


Thanks for the great response we’ve had to this event. Keep those entry forms coming. We allow two per email address and the deadline is MONDAY November 30th.


Next live appearance

Saturday January 23rd, 2016: Kansas City, Missouri

9 AM - 12:30 PM

Matt Ross Community Center

Events calendar


PREMIUM MEMBERS

All files in the "Resources/Downloads" section of the Premium site have been updated and dated as shown in the screenshot below:


The Blue Collar Investor membership

Premium Site Files and Downloads


Market tone

Markets were tranquil during this holiday-shortened week, as US economic data were predominantly positive and investors seemed more accepting of a rate hike in December. However, Chinese stocks fell on Friday, as investors grew nervous over officials’ efforts to regulate brokers. The Chicago Board Options Exchange Volatility Index (VIX) traded near a calm 15, down from 20 in recent weeks. This week’s reports:

  • US GDP grew at an upwardly revised 2.1% annual pace in the third quarter, according to the US Department of Commerce but still down from a 3.9% growth rate in the second quarter. The latest reading was revised higher largely because inventories grew more than first estimated
  • Consumer spending, a bright spot, increasing at a 3% rate.
  • Personal income rose 0.4%
  • The personal savings rate rose to 5.6%, its highest level in nearly three years
  • The Conference Board’s consumer confidence index fell in November to the lowest level in more than a year, dropping to 90.4 from 99.1 in October
  • The future expectations index dropped to 78.6 from 88.7, a two-year low, as the job market was viewed less positively
  • Orders for US durable goods rose 3% in October after a decrease of 0.8% in September
  • The sale of new US single-family homes increased in October by 10.7% to a seasonally adjusted annual rate of 495,000
  • However, existing-home sales fell by 3.4% to an annual rate of 5.36 million units
  • The S&P/Case Shiller composite index of home prices in 20 US cities increased 5.5% from a year earlier in September, up from a 5.1% year-over-year rise in August. The report represents an increase in residential real estate and supports a US Federal Reserve rate hike in December
  • Initial jobless claims fell 12,000 to 260,000 for the week ending November 21st. Initial claims have now been below the 300,000 threshold for 38 straight weeks and are close to 40-year lows
  • Continuing claims increased 34,000 to 2.21 million for the week ending November 14th

For the week, the S&P 500 rose by 0.05% for a year to date return of 1.52%.

Summary

IBD: Confirmed uptrend

GMI: 6/6- Buy signal since market close of October 19, 2015

BCI: Same stance as last week: Cautiously bullish using an equal number of in-the-money and out-of-the-money strikes. I remain fully invested using 50% in-the-money strikes until the Fed makes its position on interest rates known and evaluating the ensuing market reaction. I believe that most institutional investors have factored in a 25 basis point rate hike with moderating guidance from the December Fed meeting.

Happy holidays,

Alan (alan@thebluecollarinvestor.com)

Can We Use Deep-In-The-Money Puts to Buy a Stock at a Discount?

$
0
0

One of the practical applications of selling cash-secured puts is to buy shares “at a discount” In my books and DVDs I use out-of-the-money puts in lieu of setting limit orders in order to accomplish this goal. Some of our members have inquired about using deep in-the-money puts (strike well above current market value) instead of out-of-the-money strikes in order to both buy a stock at a discount and capture additional premium as well. Let’s break this down the Blue Collar way to see if this approach should be in our arsenal. I am using Michael Kors Hldgs Ltd. (NYSE: KORS) trading at $44.15 at the time I am writing this article and we will review 5-week returns.


KORS option chain as of 9/14/2015 (puts and calls)


Let’s compare the deep in-the-money $50.00 strike with the out-of-the-money $42.50 and $40.00 strikes (all highlighted in brown) using the BCI Put Calculator:


strike price selection for option-selling

Put Calculations for KORS

The deep in-the-money $50.00 strike creates an opportunity to purchase KORS at a minuscule discount of 0.34% whereas the out-of-the-money puts generate much more significant discounts of 6.80% and 10.99%. Now one might inquire about the huge unexercised return of 13.64%. In order to generate that return, share value would have to move from $44.15 to above the $50.00 strike, possible but unlikely. If we are that bullish, I would prefer out-of-the-money covered calls highlighted in yellow in the left side of the options chain shown above. Here are the calculations from the multiple tab of the Ellman Calculator:


Including upside potential (price movement from current market value up to the respective strike) the $45.00 and $47.50 strikes offer potential 1-month returns of 5.5% and 9.2%

***For a FREE copy of the Basic Ellman Calculator and many additional free resources, click on the “Free Resources” link on the top black bar of these web pages, enter your email address and you’re in.


Discussion

The best way to buy a stock “at a discount” is to sell out-of-the-money puts. The deeper out-of-the-money we go, the greater the discount but the less likely for the options to be exercised. If unexercised, however, we still generate a nice return from the put premium. If bullish, look to incorporating out-of-the-money call options into our strategy.


Option Liquidity and our Premium Stock report

A few of our new members have inquired about the open interest column in our Weekly Stock reports. First, let’s have a look:


The Blue Collar Investor premium membershjip

Premium Stock report- Open Interest Column


The column circled in red reads “NTM OI > 100 Cntr.” This stands for near-the-money strikes with open interest of more than 100 contracts. A “Y” means that at least one NTM strike meets the guideline; an “N” means that no NTM currently has more than 100 contracts. The blue arrows (HELE and CATY) point to the latter situation. The question we receive periodically is why do we include stocks like HELE and CATY?  There are two reasons we include such securities:

  • Option liquidity which is measured after market close on Friday can change during the week and perhaps meet our guideline of > 100 contracts and/or a bid-ask spread of $0.30 or less
  • We have a significant number of members who also use these lists for the “stock only” (no options) portion of their portfolios

By including “Y” or “N” in the OI column, it is time efficient to either consider or reject these securities.


Blue Collar Scholar Competition: 

Contest leaders as of Friday’s market close (S&P 500 reading at the end of the year)

Vincent L

Joe S

Evelyn K


Sample Commentary from Dagmar:

“The weekly chart of the S&P 500 is in an uptrend, the monthly chart is reversing up and resistance is the previous all-time high. Usually, from October to December and into Christmas, the market sees an uptrend”.


Next live appearance

Saturday January 23rd, 2016: Kansas City, Missouri

9 AM – 12:30 PM

Matt Ross Community Center

Events calendar


Market tone

US stock indices were flat for the week, reflecting the mixed economic data of the week. The CBOE Volatility Index (VIX) dipped below 17 after reaching 19 on Thursday.  This week’s reports:

  • US nonfarm payrolls increased by 211,000 in November, and revisions added a total of 35,000 jobs to the September and October stats. With the revision, October’s payrolls grew 298,000
  • The unemployment rate was flat at 5.0%
  • The U-6 broad measure of unemployment, which counts those in part-time jobs and those who have given up looking for work, moved up to 9.9%
  • Average hourly earnings grew 0.2% in November and rose 2.3% year-over-year.
  • The Institute for Supply Management’s gauge of US manufacturing activity fell to 48.6 in November from 50.1 in October, contracting for the first time since 2012 and the weakest reading since June 2009
  • The ISM index of nonmanufacturing activity fell to 55.9 in November from 59.1 in October
  • New orders, employment, backlogs and export orders all dropped although the US service sector has grown each month for nearly six years
  • US nonfarm worker productivity increased 2.2% in the third quarter, down from 3.5% in the second quarter
  • Employees worked 0.3% fewer hours, while unit labor costs rose 1.8% and real hourly compensation was up 2.4%
  • US auto sales topped an 18 million annual rate for a record third straight month in November. At this pace, the industry is set to shatter in 2015 the 17.35 million mark set in 2000. November’s sales were up 1.4% from a year earlier assisted by cheap gasoline and low financing
  • The US trade deficit widened 3.4%. Exports fell 1.4% and imports declined 0.6%. The decline in exports stems from weak demand abroad and a strong US dollar. Imports have slumped largely because of lower costs for oil and food
  • Initial jobless claims rose 9,000 to 269,000 for the week ending November 28th
  • Jobless claims remain near 40-year lows
  • Continuing claims rose 6,000 to 2.16 million for the week ending November 21st

For the week, the S&P 500 rose by 0.08% for a year to date return of 1.59%.

Summary

IBD: Uptrend under pressure

GMI: 3/6- Buy signal since market close of October 19, 2015

BCI: Cautiously bullish using an equal number of in-the-money and out-of-the-money strikes. I remain fully invested using 50% in-the-money strikes until the Fed makes its position on interest rates known and evaluating the ensuing market reaction. I believe that most institutional investors have factored in a 25 basis point rate hike with moderating guidance for the December Fed meeting.

Wishing you the best in investing,

Alan (alan@thebluecollarinvestor.com)


Covered Call Writing and Inverse ETFs: Generating Cash in Extreme Bear Markets

$
0
0

Inverse Exchange-Traded Funds (ETFs) use derivatives to bet against the direction of financial markets. These are known as short or bear ETFs and will make money if markets decline in value. They will lose money, however, if markets move against the bet. Covered call writers who have a bearish market outlook may find these funds useful. Inverse ETFs will UNDERPERFORM in normal market conditions. In extreme bear market environments, covered call writers and put-sellers may want to utilize these securities to generate income from both option sales and security appreciation.


Popular Inverse ETFs with adequate option liquidity (associated benchmark)

  • PSQ: Short QQQ (Nasdaq-100)
  • DOG: Short Dow 30 (DJIA)
  • SH: Short S&P 500 (S&P 500)
  • RWM: Short Russell 2000 (Russell 2000)


S&P 500 comparison chart (as of 1/20/2016)

covered call writing in bear markets

Comparison Chart: S&P 500 vs. Inverse ETFs

Note that the inverse ETFs have appreciated in value over the past three months while the S&P 500 has declined by 8.5%.


Covered call writing example: Options chain for SH (Short the S&P 500)

inverse ETFs and covered call writing

Options Chain for SH as of 1/20/2016


1-month calculations

inverse ETFs and covered call writing


Using the Basic Ellman Calculator, we see that initial 1-month returns calculate to 2.2% with a possibility of an additional 0.6% if share price moves to the $23.00 strike. This would result in a potential 2.8%, 1-month return. As always, we must be prepared with our exit strategies if a trade turns against us.

***For a FREE copy of the Basic Ellman Calculator, click on the “Free Resources” link on the top black bar of these web pages.


Earnings season

As we enter another earnings season, exchange-traded funds (including inverse ETFs) offer the advantage of not managing earnings reports since ETFs are baskets of stocks with some having positive and others negative results.


Discussion

Inverse ETFs are securities available to us when selling options. They are most appropriate in extreme bear market environments as they will allow us to generate both option profit and share appreciate as markets decline. We must be prepared with our exit strategy arsenal and have the flexibility to change to more conventional securities when markets turn positive. Historically, markets go up.


Option Greeks: New product now available (for $0.99)

In the BCI store:

http://www.thebluecollarinvestor.com/alan-ellman-e-book-option-greeks-analyzed-for-retail-investors/


Amazon kindle:

http://www.amazon.com/dp/B01AZG08UU

***Free to PremiumMembers


Upcoming live appearance

New York Stock Traders Expo

February 21st – 23rd

Marriott Marquis Hotel, NYC

http://www.newyorktradersexpo.com/expert-details.asp?speakerID=891071A


Alan Ellman-The Blue Collar Investor


Events calendar


JUST ADDED:  I was recently interviewed by the Options Industry Council (OIC) Radio Network and will be provided with a free link to share with our members. Keep an eye on this site for that link. I will also be part of an OIC Panel Discussion on Tuesday January 26, 2016 and will get you that link as well once I receive it from the OIC.

OIC_Logo

Market tone

Global markets rebounded towards the end of the week as comments from European Central Bank President Mario Draghi suggested further action to boost inflation toward the ECB’s target rate. Comments from Chinese and Japanese policymakers also hinted at further action. Market volatility, as measured by the Chicago Board Options Exchange Volatility Index (VIX) declined to 23.5 after a spike above 32 earlier in the week. Crude oil prices were also elevated slightly at the end of the week. This week’s reports:

  • Oil recovered late in the week on hopes of additional monetary and fiscal stimulus from Europe, Japan and China and less aggressive Fed tightening
  • New applications for unemployment benefits rose to 293,000 in the week ending January 16th
  • The US Consumer Price Index fell 0.1% in December
  • For all of 2015, prices rose 0.7%, according to the US Department of Labor
  • Sluggish inflation measures call into question the need for additional Fed rate hikes.

For the week, the S&P 500 rose by 1.41% for a year-to-date return of – 6.70%.

Summary

IBD: Market in correction

GMI: 0/6- Sell signal since market close of December 10, 2015

BCI: 1/3 of my stock investment portfolio remains in cash short-term. Favoring only deep out-of-the-money puts and in-the-money calls on active positions. Although an up week is welcome news, one week does not confirm a bottom so caution remains a focus in my current investment portfolio. With earnings season heating up, I expect a more positive market short-term. Plan to get more aggressive when markets calm.

Best regards,

Alan (alan@thebluecollarinvestor.com)

Gold ETFs and Implied Volatility in Bear Markets

$
0
0

Lately, I’ve been writing about selling options in bear markets. No surprise here as the market is down about 10% in the past three months. This, of course, is challenging for all investors but manageable to those who have achieved the three required skills for option-selling (stock selection, option selection and position management). Market conditions will dictate and give direction as to the type of securities best-suited for our current portfolios and the most appropriate strike prices to use.

In the past several weeks we have seen the re-appearance of gold exchange-traded funds (ETFs) onto our Premium ETF Reports. Even in bear and volatile markets, there are always securities that perform well and it is imperative for Blue collar Investors to locate these underlyings.


Gold ETFs and implied volatility

Here are the three gold ETFs and their associated implied volatility that earned their way onto our Premium ETF Watch List on 2/10/2016:

  • GDX: 53.52
  • GDXJ: 51.24
  • GLD: 19.62


Performance chart of Gold ETFs compared to the S&P 500 (3-month chart):

covered call writing in bear markets with gold ETFs

Gold ETFs vs The S&P 500


With the S&P 500 down about 10% over the past three months, the gold ETFs were up between 10% and 27%. The overall implied volatility of the S&P 500 at the time was 24.14. Before even checking option chains we know that GDX and GDXJ are much more volatile and therefore riskier than GLD. They also should generate higher premiums than GLD. Since we are presuming a bear market environment, I selected only in-the-money strike prices. Here are the calculations generated by the Basic Ellman Calculator:

covered call writing with exchange-traded funds

  • Yellow field: Time value returns (intrinsic value deducted)
  • Brown field: The amount of downside protection of the option profit (not breakeven)
  • Purple field: The breakeven point, below which we start losing money


Results of calculations

GLD produced the lowest option profit returns and smallest downside protection of those profits. Because GLD had the lowest implied volatility, this is what we expected. Conservative investors with low risk-tolerance may prefer the GLD $111 strike which generated a 5-week return of 1.5% (time value only) which was protected by 2.6% on the downside. More aggressive investors may opt for the GDX $15.50 strike which generated a 5-week time return of 3.4% which was protected by 7.8% to the downside. I created the Ellman Calculator to assist us in making the best investment decisions based on our personal risk tolerance and overall market assessment.


Discussion

Gold ETFs may represent an investment opportunity in certain bear market environments. We must be diligent in evaluating the risk incurred in our trades to make sure that risk matches our trading style and personal risk-tolerance.


Upcoming live appearance

New York Stock Traders Expo

February 21st – 23rd

Marriott Marquis Hotel, NYC

http://www.newyorktradersexpo.com/expert-details.asp?speakerID=891071A


Trader’s Expo video

Click here


Market tone

After two positive weeks, stocks had a difficult week, with bank stocks among the worst-performing. Investors are troubled that negative interest rates and other monetary policies have not been effective and that central bankers will have no tools left if economies head in the direction of recession. The Chicago Board Options Exchange Volatility Index (VIX) rose to 25.5 from 22 last week. This week’s reports were mostly positive:

  • US January retail sales rose a better-than-expected 0.2%, and December sales were revised up to 0.2% from the previously reported -0.1%
  • During her semiannual monetary policy testimony to Congress, US Federal Reserve Chair Janet Yellen said that the Fed was quite surprised by the movements in oil prices and the extent of the dollar’s strength. She did not rule out the possible use of negative interest rates
  • Yellen said it is premature to say a recession is probable, despite the fact that global financial and economic developments reflect negatively on the US economic outlook
  • A Wall Street Journal survey of economists and CEOs showed that the odds of a US recession in the next 12 months have risen to 21% from around 10% at the end of 2015 mainly due to global concerns
  • Despite chaotic financial markets and growing recession fears, US weekly jobless claims showed no signs of trouble for the US labor market
  • Initial claims for unemployment benefits fell 16,000 to 269,000, not far from the post-recession low of 256,000

For the week, the S&P 500 declined by 0.82% for a year-to-date return of – 8.77%.

Summary

IBD: Market in correction

GMI: 1/6- Sell signal since market close of December 10, 2015

BCI: After two positive weeks, we had a down week of a bit less than 1%, confirming that the market has yet to establish a firm bottom. Friday’s rally was a positive as was the consistent bounce off the S&P level of support at 1812. 1/3 of my stock investment portfolio remains in cash short-term. Favoring only deep out-of-the-money puts and in-the-money calls on active positions. 

***U.S. securities markets will be closed Monday, Feb. 15, for Presidents Day.

Best regards,

Alan (alan@thebluecollarinvestor.com)


Rolling Up in the Same Contract Month: Comparing Before and After Scenarios

$
0
0

Rolling up is a useful exit strategy for both covered call writing and put-selling. However, in my humble opinion, it rarely benefits us to roll up in the same contract month. The main reason for this conclusion is that we are dealing with a stock that has substantially appreciated in value in a relatively short time frame. The success of the rolling up strategy in the same contract month is dependent on that stock maintaining that share value or even accelerating even higher. In other words, we are asking a lot of this security while risking our unrealized gains from the initial option sale. In this article we will evaluate a trade shared with me by Preacher John of Mexico (they call him Preacher in Cancun where he teaches the BCI methodology):


The initial trade in one-contract format

3/22/2015: Buy 100 x PAYC at $51.10

3/22/2015: Sell 1 x $50.00 call at $2.10

3/22/2015: Initial returns are 2% with downside protection (of that profit) of 2.2% as shown in the screenshot below using the multiple tab of the Ellman Calculator:

rolling up

PAYC: Initial returns using the Multiple tab of the Ellman Calculator


Position evaluation six days later

  • PAYC price moves up to $56.69
  • Value of the $60.00 call (“ask”) is $7.10
  • Bid price of the $55.00 call (should we decide to roll up in the same month) is $2.55


Situation if we do not roll up in the same contract month

We are guaranteed a 2%, 1-month return as long as share value does not decline by more than 12% by expiration (move from $56.69 to under $50.00). This represents a safe scenario where our initial investment has been maximized.


Situation if we do roll up in the same contract month

Our maximum share appreciation is now up to the $55.00 strike which represents a credit of $3.90 from the initial purchase price of $51.10. We also have an option debit of $2.45 [($2.10 + $2.55) – $7.10]. Since we used the intrinsic value of the $7.10 buy-to-close option to enhance the value of our shares, our cost basis is now $55.00. Let’s calculate:

($3.90 – $2.45/ $55.00 = 2.6% with downside protection of that profit of 3%

Chart summary of two approaches


exit strategies for covered call writing

Rolling up comparison


This chart gives clarity to the two positions. Rolling up will generate an additional 0.6% profit and lose 9% of our position protection. The question we must ask ourselves is whether that amount of additional profit potential is worth the loss of a majority of our protection at that point in time. I’ll leave that for you to answer but also present it to you as to the reason why I rarely roll up in the same contract month.


Is there any other way to take advantage of a situation like this?

As Blue Collar Investors, this is the question we must ask ourselves and the answer is “you bet” Frequently, we can implement the mid-contract unwind exit strategy when share price has accelerated significantly in a short time frame. This is a topic I have written about in detail on pages 264 – 271 of the classic version of the Complete Encyclopedia and pages 105 – 111 and pages 243 – 252 of Volume 2 of The Complete Encyclopedia.


Discussion

Before implementing an exit strategy we must weigh its pros and cons as well as alternate approaches that may better meet our needs. For those of us who are conservative investors with capital preservation as a key focus, the mid-contract unwind exit strategy may be more appropriate than rolling up in the same contract month when share value has accelerated significantly early in the contract.


The Blue Collar Investor in Spain’s financial magazines

Click here


Live interview

On March 15th at 9 PM ET, I will be interviewed live on blog talk radio (Solutionsology Radio). I will provide the link to this event once I receive it. The focus of the conversation will be about my third book, The Complete Encyclopedia for Covered Call Writing.


Recently added

April 26, 2016

Options Industry Council Panel Discussion on Income Generation

4:30 – 5:30 PM ET

Link to follow

OIC_Logo

Market tone:

Global markets rose this week with signals of oil prices stabilizing and Chinese growth concerns having fewer international ramifications. The Chicago Board Options Exchange Volatility Index (VIX) fell to 16.8 from 19.5 this week. This week’s reports:

  • Friday’s unemployment report showed solid job gains in February — but wage growth dipped to 2.2% year over year from 2.5% in January
  • Overall, the data suggests that the US economy continues to expand at a steady but modest pace
  • A number of the largest shale oil producers in the United States have announced production cuts of approximately 5% to 10% this year as crude oil prices, which have steadied in recent weeks, experienced modest gains this week in the wake of the announced cuts
  • The People’s Bank of China cut its reserve requirement ratio to 17% from 17.5%, putting more money into the banking system
  • Activity picked up in most regions, according to the Beige Book, which is prepared in advance of each meeting of the US Federal Reserve’s rate-setting committee
  • Investors do not expect a hike at the March meeting. The market is currently pricing in just one rate hike over the next 12 months, as implied by futures contracts on the federal funds rate

For the week, the S&P 500 increased by 2.67% for a year-to-date return of  (-)2.15%.

Summary

IBD: Market in confirmed uptrend

GMI: 4/6- Buy signal since market close of March 2, 2016

BCI:  Despite three consecutive positive weeks, I will remain focused primarily in defensive positions, selling out-of-the-money puts and in-the-money calls in a ratio of 3-to-1 over more aggressive positions.

Wishing you the best in investing,

Alan (alan@thebluecollarinvestor.com)

Comparing Similar Covered Call Writing and Put-Selling Positions

$
0
0

Covered call writing and selling cash-secured puts are similar strategies that do have certain differences. In my book, Selling Cash-Secured Puts, Figure 68 on page 214 highlights the similarities and differences between these two strategies. In this article, I will show a real-life example of how analogous positions in each strategy frequently will yield similar returns with similar protection and therefore comparable risk-reward profiles.


Trade data

To demonstrate the mathematics of our two positions we will use the following data obtained from an options chain for Adobe Systems, Inc. (ADBE) on 12/29/2015:

  • ADBE is trading at $93.66
  • We are hypothetically bearish on the market and will favor in-the-money calls and out-of-the-money puts
  • The February 19, 2016 $92.50 call trades at $3.90 (see screenshot below left side)
  • The February 19, 2016 $92.50 put trades at $2.60 (see screenshot below right side)
  • Option chain data will be calculated by the Ellman (BCI) Calculators


covered call writing and puit-selling comparisons

Call calculations


Ellman Calculator for covered call writing

Calculating Call Returns for ADBE


Put calculations

Put calculator

Put Calculations for ADBE


Similarities in returns

  • Call returns (ROO or time value only) comes in at 3.0% while the ROO for the put positions calculates to a similar 2.89%
  • These are both the maximum profits achievable


Similarities in protection

The Ellman Calculator for covered call writing (top chart) shows a downside protection of 1.2%. This relates to protection of the initial profit or ROO (3.0%). You will note that the actual position breakeven is $89.76 which represents 4.2% of protection down to breakeven ($3.90/$93.66). On the lower screenshot of the put calculator we see a breakeven (stock cost basis, if exercised) at $89.90, a 4.01% discount from $93.66.


Discussion

Comparable covered call writing and put-selling positions will generate similar risk-reward profiles. In the real-life example presented in this article, both put and call strikes were $1.16 either in- or out-of-the-money. Both positions yielded returns near 3% with protection to breakeven of near 4%. It is certainly to our advantage to master the similarities and differences between these two strategies so we may take advantages of their strengths and weaknesses.


Next live appearance: Plainview, New York
Tuesday evening, April 19th
Also:

April 20, 2016

Solutionsology Radio interview Part II

9 PM – 10 PM

Discussion about my third book, The Complete Encyclopedia for Covered Call Writing

Link to listen


April 26, 2016


Market tone

  • Global stocks rose this week as China’s economy showed more signs of stabilization. The Chicago Board Options Exchange Volatility Index (VIX) fell to 13.90 from 15.20. Oil prices rose on hopes for production caps from major oil-producing nations at a meeting in Doha this weekend. This week’s reports and international news of import:
  • In China, industrial production, retail sales and fixed asset investment all rebounded in March following disappointing reports in February
  • A Brazilian congressional committee recommended impeachment earlier this week to remove President Dilma Rousseff from office
  • Claims for state unemployment insurance fell to their lowest level since 1973, a bullish signal for our economy. Only 253,000 first-time claims were filed
  • Global oil supply will move closer to balance late this year, according to the International Energy Agency.  The oversupply is expected to fall to 200,000 barrels per day from 1.5 million barrels per day in the first half of 2016
  • The global economy is expected to grow 3.2% in 2016 and 3.5% in 2017, according to recent International Monetary Fund projections
  • The Italian government agreed on a draft plan to support the banking system
  • British prime minister David Cameron finds himself embroiled in the Panama Papers scandal as he tries to lead the “remain” campaign ahead of the June 23rd referendum on UK membership in the European Union. The average of six recent polls points to a statistical dead heat.
  • US banking regulators gave failing grades to five of the eight largest banks in the United States on their bankruptcy and liquidation plans in the event of the banks’ failure. The plans were a requirement of the 2010 Dodd-Frank Act. The five banks have until October to amend their plans to the satisfaction of the US Federal Reserve and the Federal Deposit Insurance Corporation
  • Earnings season kicked off this week. While only a small fraction of S&P 500 companies have reported Q1 earnings, early results have been excellent as 79% reported earnings that exceeded analyst expectations, while 21% reported earnings below expectations

THE WEEK AHEAD

•OPEC and non-OPEC oil producing countries meet in Doha on Sunday April 17th to discuss a production cap

•The spring meeting of the International Monetary Fund and the World Bank concludes on Sunday April 17th

•New York Federal Reserve Bank president William Dudley speaks on Monday April 18th

•The European Central Bank holds a rate-setting meeting on Thursday April 21st


For the week, the S&P 500 rose by 1.62% for a year-to-date return of 1.80%.

Summary

IBD: Market in confirmed uptrend

GMI: 4/6- Buy signal since market close of March 2nd

BCI: Moderately bullish, favoring out-of-the-money strikes 2-to-1. A good first week of earnings season.


WHAT THE BROAD MARKET INDICATORS (S&P 500 AND VIX) ARE TELLING US
The S&P 500 is currently in an uptrend (higher highs and higher lows) while the VIX (CBOE Volatility Index) is under 14. In the past six months, the S&P 500 is up 3% while the VIX has declined by 15%. The near term market trend is BULLISH.
________________________________________________________________________

Wishing you the best in investing,

Alan (alan@thebluecollarinvestor.com)

Defensive Call and Put Positions in Bear and Volatile Markets

$
0
0

Strike price selection can be tailored to our covered call writing and put-selling trades based on overall market assessment. In bear and volatile market conditions we favor in-the-money calls and deeper out-of-the-money puts (lower than current market value). In this article, we will evaluate defensive trades for Smith & Wesson Hldg (SWHC) as of 1/11/2016, the day after the worst week to start a stock market trading year ever in the history of US stock markets.


Options chain as of 1/11/2016

selling options in bear markets

SWHC Options Chain

With SWHC trading at $22.09, the $21.00 in-the-money February 19, 2016 call generates $1.85 and the $21.00 out-of-the-money put generates $0.75. These are 6-week returns.

Next let’s turn to our calculators:


Call calculations for SWHC: Multiple tab of the Ellman Calculator

covered call writing in bear markets

SWHC Call Calculations


The advantages of in-the-money calls in bear market environments are readily noticeable:

  • A 6-week initial return of 3.6%, 31.2% annualized
  • A 4.9% protection of that initial profit
  • A breakeven of $20.24, $1.85 less than current market value, an 8.37% protection to breakeven


Put calculations for SWHC


Strike price selection for put-selling

Put calculations for SWHC


The advantages of out-of-the-money puts in bear market environments are readily noticeable:

  • A 6-week initial return of 3.70%, annualizing to 34.66%
  • If exercised, shares are purchased at a 8.33% discount from current market value (breakeven)


Discussion

In bear and volatile market conditions we can tailor our option-selling strategies by utilizing in-the-money calls and out-of-the-money puts. Using the Ellman and BCI Put Calculators will help guide us to the most appropriate strike price selection based on our overall market assessment, chart technicals and personal risk tolerance.

***For free copies of the Basic Ellman Calculator for covered call writing and the BCI Put Calculator, click on the “Free Resources” link on the top black bar of our web pages. Or click here.


May live events

May 10th

Caesar’s Palace- Las Vegas

Two seminars plus a book signing


May 14th

Baltimore, Maryland

How To Generate Monthly Cash Flow And Purchase Stocks At A Discount Using Two Low-Risk Option Strategies: Covered call writing and selling cash-secured puts
9:45 AM – 12 PM
 ____________________________________________________________________________
Members of the BCI team saying “hi” to another team member who lives in Australia
The Blue Collar Investor team

Stock Trader’s Expo:
Marriott Marquis Hotel in NYC

_______________________________________________________________________
Market tone
Global stocks dropped this week, led by Japanese shares as a rising yen led to investor risk aversion. The Chicago Board Options Exchange Volatility Index (VIX) rose on the week from 13.95 to 15.70. Crude oil prices rose as well. This week’s reports and international news of interest:
  • The US Federal Reserve’s Federal Open Market Committee made no move on interest rates this week and sent mixed signals on the timing of its next hike
  • The Fed removed a reference to global economic and financial conerns from the first paragraph of its statement, which some interpreted as an aggressive stance sign
  • The Fed highlighted that while labor markets have continued to improve, economic activity appears to have slowed
  • Japanese shares tumbled and the yen soared against major currencies as the Bank of Japan declined to add additional monetary stimulus despite slumping inflation data and a strong yen
  • US gross domestic product rose just 0.5% in the first quarter, the third consecutive anemic start to a new year.  Sluggish net exports and weak corporate profits were significant developments in this first quarter
  • The eurozone economy grew by 1.6% year over year in the first quarter, the same rate of growth as the final quarter of 2015. Inflation failed to keep pace, however, sliding 0.2% year over year. Falling inflation will keep the pressure on the European Central Bank to seek innovative ways to spark growth and inflation
  • A new plan from Saudi Arabia known as Vision 2030 calls for the floatation of a stake in Saudi Aramco, the state oil producer. Proceeds from asset sales, as well as other state-owned assets, will be held in a sovereign wealth fund worth as much as $2 trillion
  • GDP growth in the United Kingdom held steady at 2.1% year over year in the first quarter but economists are concerned that growth could slow in the second quarter

THE WEEK AHEAD

  • Manufacturing purchasing managers’ indices are globally released Monday, May 2nd
  • Service sector PMIs are released globally on Wednesday, May 4th
  • Eurozone retail sales are reported on Wednesday, May 4th
  • US employment data are released on Friday, May 6th
For the week, the S&P 500 fell by 1.26% for a year-to-date return of +1.05%.

Summary

IBD: Uptrend under pressure

GMI: 5/6- Buy signal since market close of March 2nd

BCI: Cautiously bullish, favoring out-of-the-money strikes 3-to-2. The markets finally succumbed to the mixed earnings signals (see AAPL, AMZN, FB).

WHAT THE BROAD MARKET INDICATORS (S&P 500 AND VIX) ARE TELLING US

The charts are beginning to show mild signs of pressure. In the past six months the S&P 500 is flat (consolidating sideways) while the VIX has moved up by 15% to above 15. The short-term trend is neutral.
________________________________________________________________________
Wishing you the best in investing,

Alan (alan@thebluecollarinvestor.com)

Jim Cramer’s Stocks and Covered Call Writing

$
0
0

Locating stocks for covered call writing and put-selling is the first step as we prepare to execute these income-generating strategies. In the BCI methodology we use a three-pronged approach to screening for these underlying securities:

  • Fundamental analysis
  • Technical analysis
  • Common sense principles (like minimum trading volume etc.)

In my books and DVDs I encourage all option-sellers to consider other screens that meet their personal risk-tolerance and trading style. Recently, a few members have inquired about using stocks selected by Jim Cramer for his charitable trust portfolio. This gave me an idea that it would be both an enjoyable and an educational experience to set up a hypothetical portfolio derived from this resource. We must keep in mind that whatever process Cramer uses to select these stocks, they are intended for a longer-term buy-and-hold portfolio, certainly a much longer time frame than our one-month option trades. That said, it is apparent that many feel that there is a high-quality feel to his selections so why not see how we can apply our covered call writing skills to a percentage of these securities? The statistics used for this article were generated on 2/3/2016.


Stocks in the charitable trust on 2/3/2016 and calculations

There were 28 stocks on the list and because the overall market was down about 9% over the past three months, most technical charts of these stocks showed bearish trend and momentum indicators. I selected the eight stocks with the most favorable chart patterns to use in a hypothetical portfolio funded with $100,000 cash. Here are the selected securities (left column):

covered call writing with Jim Cramer stocks

Covered Call Writing Portfolio Selected from Jim Cramer’s Charitable Trust List

The following steps were used to determine the number of shares to be purchased in 100 share increments:

  • Assign $12,000.00 per position understanding that some cash must be remaining for possible exit strategy execution
  • Divide the price-per-share into $12,00.00 and round to the nearest 100
  • Calculate the total cost of purchasing the shares and adjust a position if necessary
  • Check the options chain for premiums generated for near-the-money strikes (I used out-of-the-money)
  • Calculate the total premiums generated from selling the call options and percentage returns


Calculation results

$2165.00 in premiums were generated on a cost basis of $94,992.00 resulting in a 1-month initial return of 2.3%, annualized to 27.3%. $5008.00 remains in our brokerage cash account if needed for exit strategy execution. Some of the total cash ($7173.00) from premium plus amount not used to buy shares can be used to buy additional shares and sell call options on those newly acquired shares as long as at least $2000.00 remains in the cash account if position management opportunities arise.


What does the Ellman Calculator tell us?

Calc_Cramer

Purple field- The breakeven column subtracts the total option premium from current market value and shows the point below which we may start losing money

Brown field– This column shows the time value initial return for each position. As a whole, these returns calculate to a portfolio initial return of 2.3% for the one month.

Yellow column– Since we sold out-of-the-money strikes we have the potential for additional profits from share appreciation of between 1% – 2% as shown in the chart above.


Discussion

There are many resources that can be used to locate stocks for option-selling based on personal risk tolerance and trading style. In my view, the BCI methodology is one of the elite ways to locate option-selling stocks but it certainly isn’t the only resource where success can be achieved. In this article we investigated stocks from Jim Cramer’s charitable trust and demonstrated that these securities do offer significant initial returns. Of course, no matter where a stock is located, once a position is entered we must be prepared with our exit strategy arsenal as position management is just as important as stock and option selection.


Coming in July

The Blue Hour

option-selling educational series

The Blue Collar Investor presents The Blue Hour

The blue hour is the period of twilight during dawn each morning and dusk each evening when the sun is a significant distance below the horizon and the residual, indirect sunlight takes on a predominantly blue hue (typically 40 minutes in length).

The BCI team will use this theme to provide additional educational content to our members in the form of webinars, Q&A, interviews with experts and much more. Our initial 30 – 40-minute trial run will be held on July 28th at 9 PM ET in the form of a webinar with Q&A and additional comments. I will be hosting the webinar and Barry Bergman, the BCI Director of Research will be responding to your questions simultaneously. This event will be free to the first 50 premium members who sign up and will be recorded and available on the premium member site and free to all our premium members. We will be providing a series of these educational events to our premium members throughout the year. Our team is in the process of developing a landing and signup page for The Blue Hour and once ready we will open up registration. Ultimately, the development and format of The Blue Hour will depend on your suggestions and feedback.


Next live event

June 11, 2016

American Association of Individual Investors

Research Triangle Chapter

Raleigh/Durham, North Carolina

10 AM – 12 PM

Seminar information

______________________________________________________
Market tone
Global stocks were nearly unchanged for the week as the market factored in the possibility of a rate hike from the US Federal Reserve this year. The Chicago Board Options Exchange Volatility Index (VIX) rose to 15.21from 14.23 a week ago, while global Brent crude prices rose to $48.96 from $47.65. This week’s reports and international news of interest:
  • Minutes of the April Federal Open Market Committee meeting demonstrated that the Fed would like to raise rates at either its June or July meeting, conditions permitting
  • 2nd quarter US growth looks stronger while the April US employment report was slightly weaker than forecast two weeks ago as several recent data points show an increase in both economic activity and inflation
  • US industrial production rose 0.7% in April
  • The Consumer Price Index rose 0.4%, the strongest monthly reading in more than three years
  • Housing starts rose at a stronger-than-expected rate of 6.6% in April
  • Building permits rose 3.6% from the previous month
  • Japan reported a robust 1.7% annualized rate of growth in gross domestic product in the first quarter of the year
  • Tentative deal to relieve the Puerto Rico debt crisis reached The US Department of the Treasury and Republicans in the US of Representatives House have reached a tentative deal to set up a financial control board to take charge of Puerto Rico’s debt crisis No US federal funds are being committed as part of the package.
  • Saudi credit rating cut by Moody’s Moody’s Investors Service cut its rating on Saudi Arabia’s debt to A1 from Aa3 However, recently announced economic reforms could lead to a higher rating over time, the agency said.
  • China reported somewhat weaker than expected economic data this week
  • The European Central Bank’s bond buying program is beginning to run up against purchase caps in government bonds issued by some of its member countries
  • Philippines dislodges China as Asia’s fastest-growing economy as economic growth in the Philippines expanded at 6.9% in the first quarter, the fastest pace in that country since the 1970s
  • China’s growth slipped to a 6.7% annual rate in the same quarter

THE WEEK AHEAD

  • A meeting of G7 finance ministers and central bankers concludes Saturday, May 21st in Japan
  • Japan releases trade data on Monday, May 23rd
  • Flash purchasing managers’ indices are released globally on Monday, May 23rd
  • Germany’s Ifo releases its business climate survey on Wednesday, May 25th
  • Q1 UK gross domestic product is reported on Wednesday, May 25th
  • Revised Q1 US GDP data are released on Friday, May 27th
 For the week, the S&P 500 rose by 0.23% for a year-to-date return of +0.40%.

Summary

IBD: Uptrend under pressure

GMI: 0/6- Sell signal since market close of May 4th

BCI: Neutral selling an equal number of in-the-money and out-of-the-money strikes.

WHAT THE BROAD MARKET INDICATORS (S&P 500 AND VIX) ARE TELLING US

The charts are demonstrating signs of neutral to slightly bearish market movement. In the past six months the S&P 500 and the VIX have both moved down by 2%. The short-term trend is neutral.
______________________________________________________
Wishing you the best in investing,

Alan (alan@thebluecollarinvestor.com)


Exchange-Traded Fund Option-Selling in Bear Markets

$
0
0

Covered call writing and put-selling can be used in most market conditions including bear markets. In my books and DVDs, I detail the use of in-the-money call options (strikes lower than current market value), out-of-the-money put options (also lower than current market value) and securities with low-implied volatility like exchange-traded funds (ETFs). In this article we will use all three of these criteria and demonstrate the process of establishing our defensive positions using a popular ETF, QQQ.


What is QQQ?

This is the ticker symbol for the Nasdaq 100 Trust, an ETF that offers exposure to the 100 largest non-financial stocks that trade on the Nasdaq exchange. It is a popular ETF with more-than-adequate trading volume and option liquidity.


How do we establish our defensive positions with QQQ or other ETFs?

First and foremost, we must establish our initial time value return goals (we do not include intrinsic value in our return calculations). If our goal for individual stocks is 2% – 4% per month, let’s use 2% for this ETF with the understanding that this target can be adjusted based on our personal risk tolerance. ETFs, in general, generate lower option returns than individual stocks. Next, we view the options chain and select strikes that meet our 2% criteria and also offer downside protection of our call and put positions…in-the-money calls and out-of-the-money puts. We will be using the multiple tab of the Ellman Calculator for call calculations and the BCI Put Calculator for put computations.


QQQ (trading at $98.02) options chain for 1-month March 18, 2016 expirations

covered call writing and put-selling with exchange-traded funds

QQQ: Options Chain for March 18, 2016 1-Month Expirations


Highlighted in the yellow field on the left side of the screenshot are call strikes we will evaluate and in the purple field on the right are put strikes to be evaluated.


Covered call writing calculations using the multiple tab of the Ellman Calculator

covered call writing calculations

All three in-the-money call strikes meet our 2% criteria. The higher the time value returns (ROO), the lower the downside protection (profit protection, not breakeven). The column to the left of ROO shows the breakeven points. All three choices represent reasonable defensive positions to consider.


Put-selling calculations using the BCI Put Calculator

selling cash-secured puts in bear markets

Put Calculations for March 18, 2016 1-Month Expirations


All four out-of-the-money put strikes meet our initial (unexercised) return goals as highlighted by the red arrows. The row adjacent to the blue arrow calculates the percent a stock must decline to reach the breakeven point. As an example, the $93.00 out-of-the-money put strike guarantees a 1-month return of 2.01% as long as share value does not decline by more than 6.99% by expiration. All four strikes offer reasonable defensive put-selling positions to establish in a  bear market environment.


Discussion

Option-selling can be crafted to most market conditions. In bear markets we take defensive positions by selling in-the-money call options and out-of-the-money put options. Consideration should also be given to exchange-traded funds which generally (there are exceptions) have lower implied volatility than individual stocks.


Next live event- Workshop

July 16, 2016

American Association of Individual Investors

Washington DC Chapter

Northern Virginia Community College

9 AM – 12:30 PM

Seminar information and registration link

______________________________________________________

Market toneGlobal declined this week after an initial boost on dovish commentary from US Federal Reserve Chair Janet Yellen. Crude oil prices rose to $49.31 from $48.11 last week, and global Brent crude prices dipped to $49.62 from $49.72 a week ago. The Chicago Board Options Exchange Volatility Index (VIX) rose to 17.03 from 14.48 last week.  This week’s reports and international news of interest:

  • Concerns about the economic outlook have been raised by recent labor data, Fed chair Yellen said in a speech on Monday, just days after a disappointing employment report. Markets give a June rate hike extremely low odds, and a July hike is now also seen as unlikely
  • Record low 10-year bond yields were recorded this week in Germany, Japan and the United Kingdom as the Fed backed away from an expected summer rate hike
  • The average yield on European investment-grade corporate bonds is now below 1% while some issues trade with negative yields
  • Switzerland held a referendum on a universal basic income last weekend. The notion of sending each adult 2,500 Swiss francs a month and each child 625 — with no strings attached — was soundly defeated at the polls
  • The World Bank downgraded its global GDP forecast which now sees a 2016 growth rate of just 2.4%, down from its 2.9% January forecast. Its 2017 growth outlook was trimmed to 2.8% from 3.1%
  • Economic growth in the eurozone was revised higher in the first quarter, coming in at 0.6%, up from the prior 0.5% reading. On an annualized basis, growth grew by 1.7%. That’s the fastest rate in 12 months. Inflation, however, remains far below the ECB’s target of near 2%

THE WEEK AHEAD

  • China reports direct foreign investment, retail sales and industrial production figures on Monday, June 13th
  • The eurozone reports industrial production data on Tuesday, June 14th
  • The United States reports retail sales data on Tuesday, June 14th
  • The Swiss National Bank holds a quarterly monetary policy meeting on Thursday, June 16th
  • Eurogroup finance ministers meet on Thursday, June 16th
  • The Philadelphia Fed’s manufacturing index is released on Thursday, June 16th
For the week, the S&P 500 was unchanged for a year-to-date return of +2.70%.

Summary

IBD: Market in confirmed uptrend

GMI: 6/6- Buy signal since market close of May 25th

BCI: Cautiously bullish favoring out-of-the-money strikes 3-to-2


WHAT THE BROAD MARKET INDICATORS (S&P 500 AND VIX) ARE TELLING US

The charts are demonstrating signs of modestly bullish market movement. In the past six months the S&P 500 has been moved up 2.0% and the VIX has moved down by 11% to 17.03. The short-term trend is slightly bullish.
______________________________________________________
Wishing you the best in investing,

Alan (alan@thebluecollarinvestor.com)


Viewing all 108 articles
Browse latest View live